...
| Numbered figure captions |
|---|
| SubtitleText | Coverage plot. Average read depth (times, in covered regions) is shown by columns and quantified on the left y-axis. Genome coverage (%) is shown by the black line and quantified on the right y-axis |
|---|
| AnchorName | coverage-plot |
|---|
|
 Image Removed Image Removed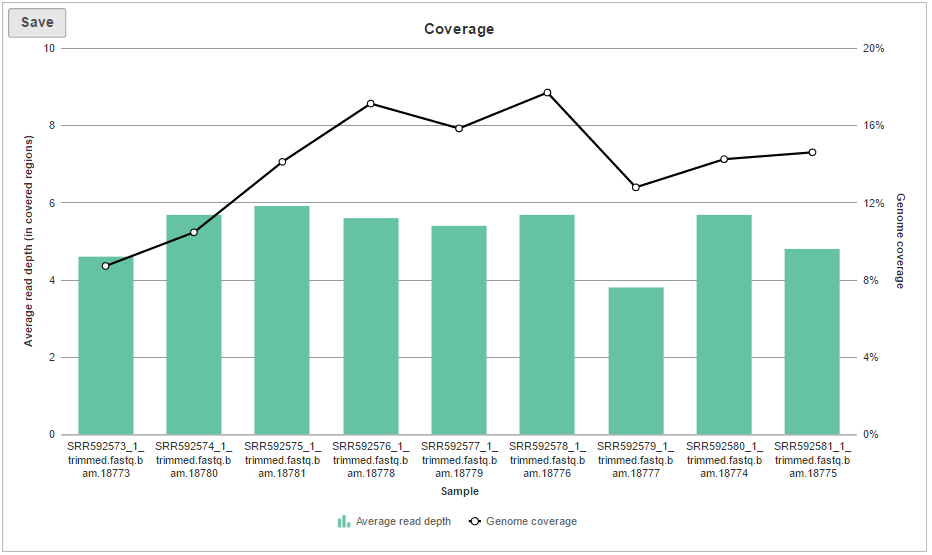 Image Added Image Added
|
The last graph is Average alignments per read (Figure 5) and shows the average number of alignments for each read, with samples as columns. For single-end data, the expected average alignments per read is one, while for paired-end data, the expected average alignments per read is two.
...