...
| Numbered figure captions |
|---|
| SubtitleText | Alignment breakdown plot. Each sample is a column. Fraction of reads with respect to their alignment status is given on the left-side y-axis and colour coded. Total number of reads is depicted by the black line and can be red on the right-side y-axis |
|---|
| AnchorName | breakdown-plot |
|---|
|
 Image Removed Image Removed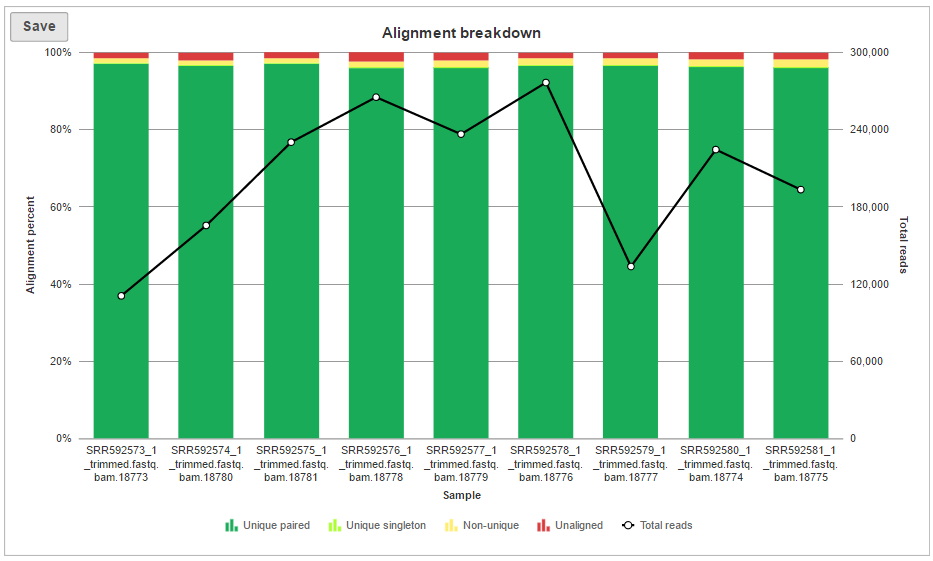 Image Added Image Added
|
The Coverage plot (Figure 4) shows the Average read depth (in covered regions) for each sample using columns and can be red off the left-hand y-axis. On the same plot, the percentage of covered genome bases (Genome coverage) in each sample is represented by the black line and quantified by the right-hand y-axis.
...