...
| Numbered figure captions |
|---|
| SubtitleText | ERCC spike-ins plot. Lines (one per sample) correspond to regression lines between actual spike-in concentrations and observed number of alignments. Dots represent present ERCC sequences with the lowest and the highest concentration |
|---|
| AnchorName | spike-ins |
|---|
|
 Image Removed Image Removed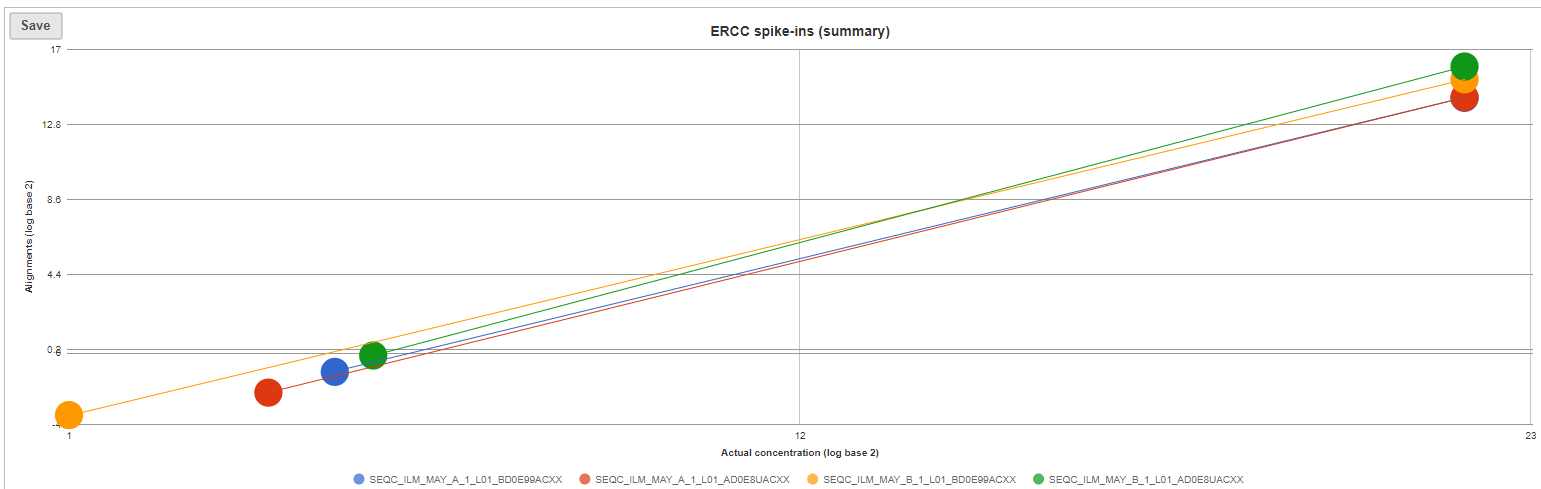 Image Added Image Added
|
Optionally, you can invoke a principal components analysis plot (
View PCA), which is based on RPKM-normalised counts, using the ERCC sequences as the annotation file (not shown).
...