...
| Numbered figure captions |
|---|
| SubtitleText | Scatter plot of actual observed alignment counts vs. probe concentration for each ERCC control within a sample. Each dot is an ERCC control, coloured by GC content and sized by concentration |
|---|
| AnchorName | scatter-plot |
|---|
|
 Image Removed Image Removed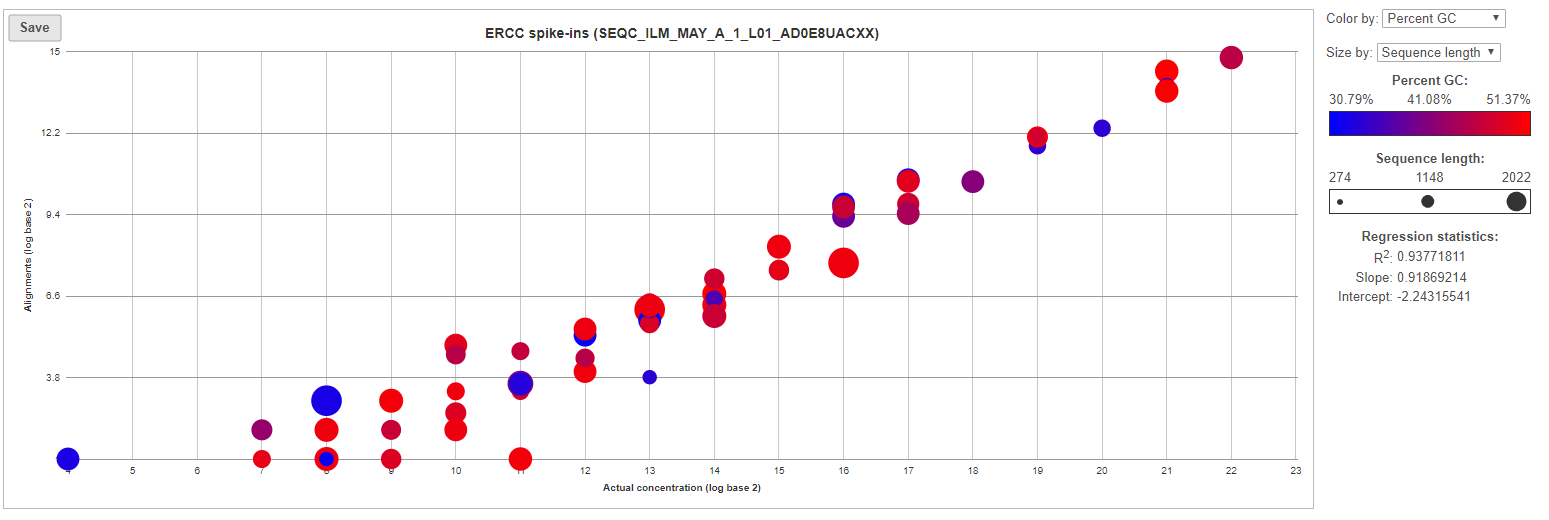 Image Added Image Added
|
The table (Figure 5) lists individual controls, with their actual concentration, alignment counts, sequence length, and % GC content. The table can be downloaded to the local computer by selecting the
Download link.
...