Page History
...
| Numbered figure captions | ||||
|---|---|---|---|---|
| ||||
|

To run SVD task,
- Click a single cell counts data node
- Click the Exploratory analysis section in the toolbox
- Click SVD
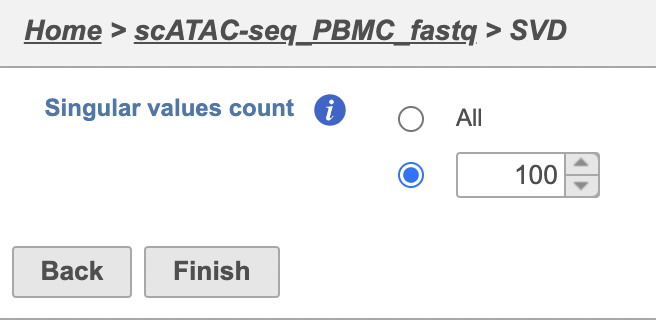
The GUI is simple and easy to understand. The SVD dialog is only asking to select the number of singular values to compute (Figure 2). By default 100 singular values will be computed if users don't want to compute all of them. However, the number could be adjusted manually or typed in directly. Simply click the Finish button if you want to run the task as default.
| Numbered figure captions | ||||
|---|---|---|---|---|
| ||||
|
The output of TF-IDF normalization is a new data node that has been normalized by log(TF x IDF). We can then use this new normalized matrix for downstream analysis and visualization (Figure 2).
References
- Hao Y, Hao S, Andersen-Nissen E, et al. Integrated analysis of multimodal single-cell data. Cell. 2021;184(13):3573-3587.e29. doi:10.1016/j.cell.2021.04.048
- https://satijalab.org/seurat/articles/weighted_nearest_neighbor_analysis.html
...
Overview
Content Tools