Page History
...
| Numbered figure captions | ||||
|---|---|---|---|---|
| ||||
|
oiioioio
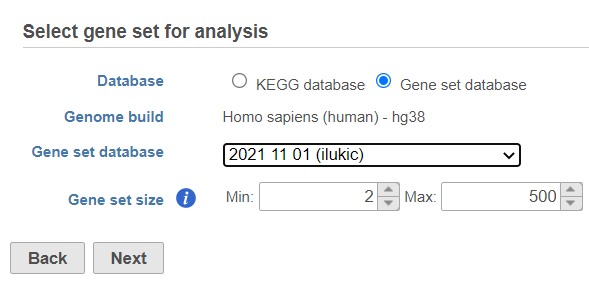
Once your choices are made, push Next to proceed.
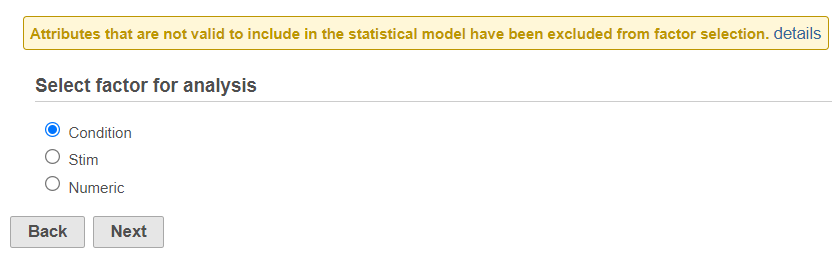
In the second part of the set up (Figure 4) pick the experimental factor for GSEA (in this example: Condition, Stim, Numeric). The dialog will list only the factors with two categories; if your project contains additional factors, which have a single category or more than two categories, a warning message will be displayed at the top.
| Numbered figure captions | ||||
|---|---|---|---|---|
| ||||
|
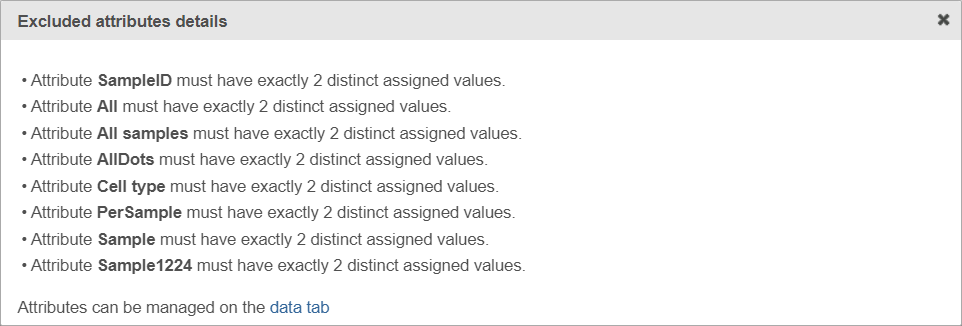
If the warning message is displayed, click on the details link to see which factors are unavailable and why (Figure 5).
| Numbered figure captions | ||||
|---|---|---|---|---|
| ||||
|
Select the experimental factor that you want to run GSEA on and push Next.
The third dialog is Define comparisons (Figure 6). The box on the left side displays the categories of the selected factor (shown as Factor). Use the arrow buttons (>) to move one of the factors to the Denominator box (that factor should be interpreted as the reference category) and the other factor to the Numerator box. Confirm your selection by pushing the Add comparison button and the comparison will be added to the Comparisons table.
| Numbered figure captions | ||||
|---|---|---|---|---|
| ||||
|

Push Finish to launch GSEA with the default settings or click on the Configure icon to customize the analysis (Figure 7).
References
- Subramanian A, Tamayo P, Mootha VK, et al. Gene set enrichment analysis: a knowledge-based approach for interpreting genome-wide expression profiles. Proc Natl Acad Sci U S A. 2005;102(43):15545-15550. doi:10.1073/pnas.0506580102
- Mootha VK, Lindgren CM, Eriksson KF, et al. PGC-1alpha-responsive genes involved in oxidative phosphorylation are coordinately downregulated in human diabetes. Nat Genet. 2003;34(3):267-273. doi:10.1038/ng1180
Overview
Content Tools