Page History
...
In the dialog, select attribute. The available attributes are categorical attributes can be seen on the data node which includes project level attributes and data node local annotation--, e.g. graph-based cluster result (Figure 1). If the task is run on graph-based clustering output data node, the calculation is using upstream data node which contains feature count feature counts – typically the input data node of PCA.
...
| Numbered figure captions | ||||
|---|---|---|---|---|
| ||||
|
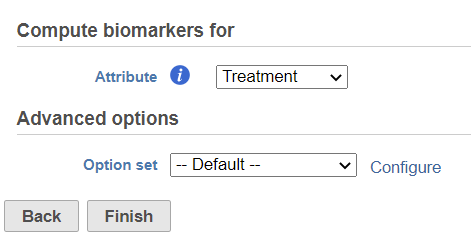
Click on the Configure of Advanced option options to change the criteria on output features (Figure 2).
...
By default, the result outputs the top 10 features that are up-regulated at least 1.5 fold change (in linear scale) for each subgroup comparing to others (ranked by the ascending p-values within each category). The result is displayed in a table with each column is a subgroup name, each row is a feature. An example is shown in Figure 3.
| Numbered figure captions | ||||
|---|---|---|---|---|
| ||||
|
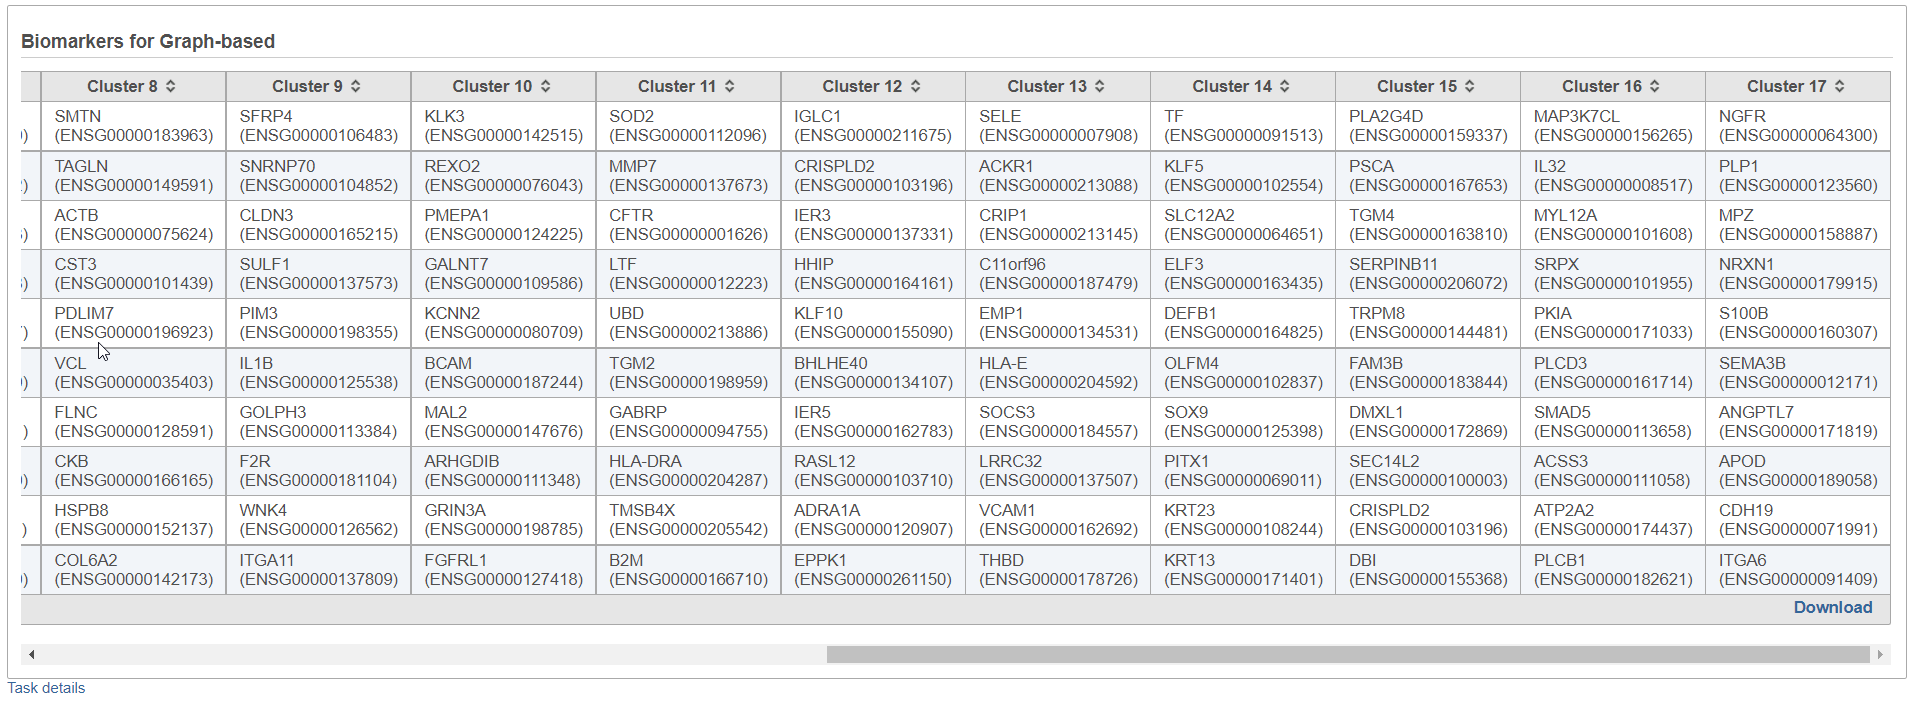
Furthermore, the Download link (lower right corner of the table report; Figure 3) downloads a .txt file to the local computer (default file name: Biomarkers.txt), which contains the full report: all the genes with fold change > 1.5, with corresponding fold change and p-values. If a subgroup has fewer biomarkers than the others, the "extra" table fields for that subgroup will be left blank.
| Additional assistance |
|---|
| Rate Macro | ||
|---|---|---|
|
...
Overview
Content Tools