Page History
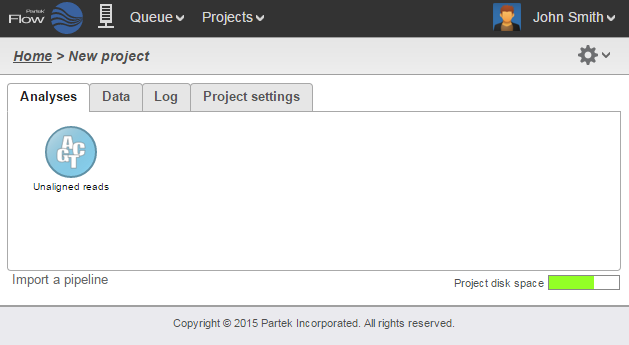
After samples have been added and associated with valid data files, in a Partek® Flow® project, a data node will appear in the Analyses tab (Figure 1). The Analyses tab is where different analysis tools and the corresponding reports are accessed.
| Table of Contents |
|---|
| Numbered figure captions | ||||
|---|---|---|---|---|
| ||||
|
Data and Task nodes
The Analyses tab contains two elements: data nodes (circles) and task nodes (rounded rectangles) connected by lines and arrows. Collectively, they represent a data analysis pipeline.
Data nodes (Figure 2) may represent a file imported into the project, or a file generated by Partek Flow as an output of a task (e.g., alignment of FASTQ files generates BAM files).
...
| Numbered figure captions | ||||
|---|---|---|---|---|
| ||||
|
The context sensitive menu
Clicking on a node reveals the context sensitive menu, on the right side of the screen.
...
| Numbered figure captions | ||||
|---|---|---|---|---|
| ||||
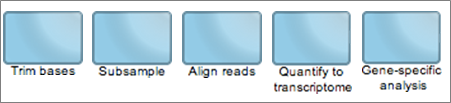
Running a task
To run a task, select a data node and then locate the task you wish to perform from the task pane. Mouse over to see a description of the action to be performed. Click the specific task, set the additional parameters (Figure 6), and click Finish. The task will be scheduled, the display will refresh, and the screen will return to the project's Analyses tab.
...
| Numbered figure captions | ||||
|---|---|---|---|---|
| ||||
Canceling and deleting tasks
Tasks can only be cancelled or deleted by the user that started the task. Running or pending tasks can be canceled by clicking the right mouse button on the task node and then selecting Cancel (Figure 8). Alternatively, the task node may be selected and the Cancel task selected from the task pane.
...
| Numbered figure captions | ||||
|---|---|---|---|---|
| ||||
Task Results and Task Actions
Selecting a task node will reveal a menu pane with two sections: Task results and Task actions (Figure 11).
...
| Numbered figure captions | ||||
|---|---|---|---|---|
| ||||
Layers
It is common for next-generation sequencing data analysis to examine different task parameters for optimization. Users may want to modify an upstream step (e.g. alignment parameters) and inspect its effect on downstream results (e.g. percent aligned reads).
...
To select a different layer, use the left mouse button to click on any node of the desired layer. All the nodes associated with the selected layer have the same color and when clicked will be displayed on the top of the stack.
Downloading Data
Data associated with any data node can be downloaded using the Download data link in the task pane (Figure 16). Compressed files will be downloaded to the local computer where the user is accessing the Partek Flow server. Note that bigger files (such as unaligned reads) would take longer to download. For guidance, a file size estimate is provided for each data node. These zipped files can easily be imported by the Partek® Genomics Suite® software.
...
Overview
Content Tools