Page History
...
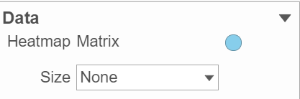
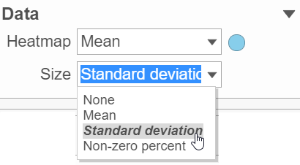
This section controls the data source used to draw the values in the heatmap. The heatmap is a color representation of the values in the matrix selected. In addition to color, you can also use the Size drop-down list to size by a set of values. Most of the data nodes contain only one matrix, so the only options available in the Size drop down are None or Matrix (Figure 8).
...
| Numbered figure captions | ||||
|---|---|---|---|---|
| ||||
|
...
| Numbered figure captions | ||||
|---|---|---|---|---|
| ||||
|
...
| Numbered figure captions | ||||
|---|---|---|---|---|
| ||||
|
...
Overview
Content Tools