Page History
SC transform task performs the variance stabilizing normalization proposed in [1]. The task's interface follows that of SCTransform() function in R R [2].
We recommend performing sctransform the normalization on a single cell row raw count data node. Select SCTransfrom task in Normalization and scaling section on the pop-up menu to invoke the dialog (Figure 1).
| Numbered figure captions | ||||
|---|---|---|---|---|
| ||||
|
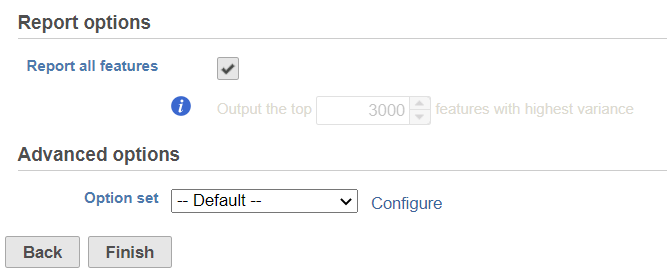
By default, it will generate report on all the input features. Unchecking the Report all features, user can specify limit the results to a certain number of features with highest variance in the report.
In the Advanced optionoptions, users can the click Configure to change the default settings (Figure 2).
| Numbered figure captions | ||||
|---|---|---|---|---|
| ||||
|

Features for parameter estimation: Specify number of features to use in estimation of parameters, ; 0 means to use all input features.
Center results: When set to Yes, center all the transformed features to have zero mean as 0expression.
Clip results: If this is set to No, outliers might have big effect and the transformed data can be very large for some features, usually the ones with few non-zero counts. When set to Yes, the range to clip the transformed data is between -sqrt(n/30) and sqrt(n/30), where n is the number of cells.
Random seed: use the same random seed to reproduce the results.
Data has been log transformed with base: specify the input data is logged or not.
The data in the output node is a matrix of standardized residual on all the features in all the observations, the range of the normalized values (residuals) that by default has the same size as the input data set. The range of normalized values is roughly between -4 and 4.
...
Overview
Content Tools