Page History
...
| Numbered figure captions | ||||
|---|---|---|---|---|
| ||||
|
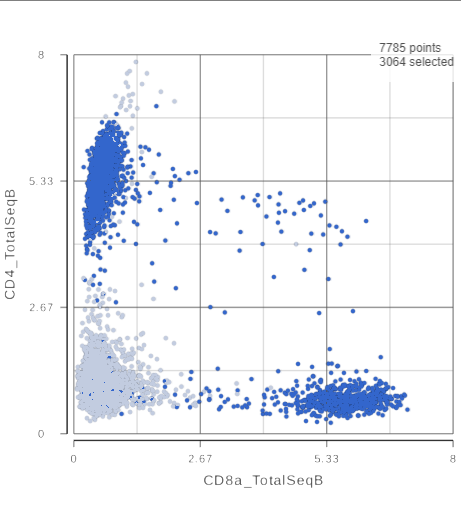
The simplest way to classifying cell types is to look for the expression of key marker genes or proteins. This approach is more effective with CITE-Seq data than with gene expression data alone as the protein expression data has a better dynamic range and is less sparse. Additionally, many cell types have expected cell surface marker profiles established using other technologies such as flow cytometry or CyTOF. Let's compare the resolution power of the corresponding CD4 and CD8A gene expression markers compared to their protein counterparts.
- Click the duplicate plot icon above the 2D scatter plot (Figure ?)
...
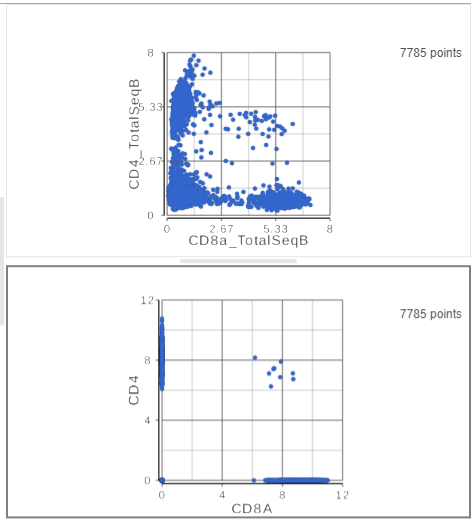
The second 2D scatter plot has the CD8A and CD4 mRNA markers on the x- and y-axis, respectively (Figure ?). The protein expression data has a better dynamic range than the gene expression data, making it easier to identify sub-populations. This an advantage of CITE-Seq data over single cell RNA-Seq data alone.
| Numbered figure captions | ||||
|---|---|---|---|---|
| ||||
|
...
| Numbered figure captions | ||||
|---|---|---|---|---|
| ||||
|
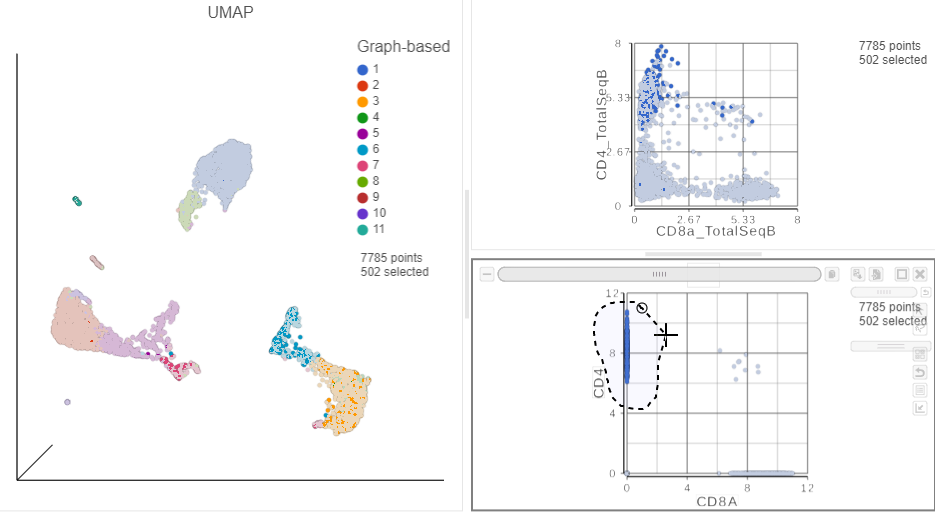
This time, approximately only 500 cells show positive expression for the CD4 marker gene. This means that the protein gene expression data is also less sparsemore sparse (i.e. there are more zeros), which further helps to reliably detect sub-populations.
...
Overview
Content Tools