...
| Numbered figure captions |
|---|
| SubtitleText | Cell barcode QA/QC task report is used to filter barcodes |
|---|
| AnchorName | Task report for Cell Barcode QA/QC |
|---|
|
 Image Removed Image Removed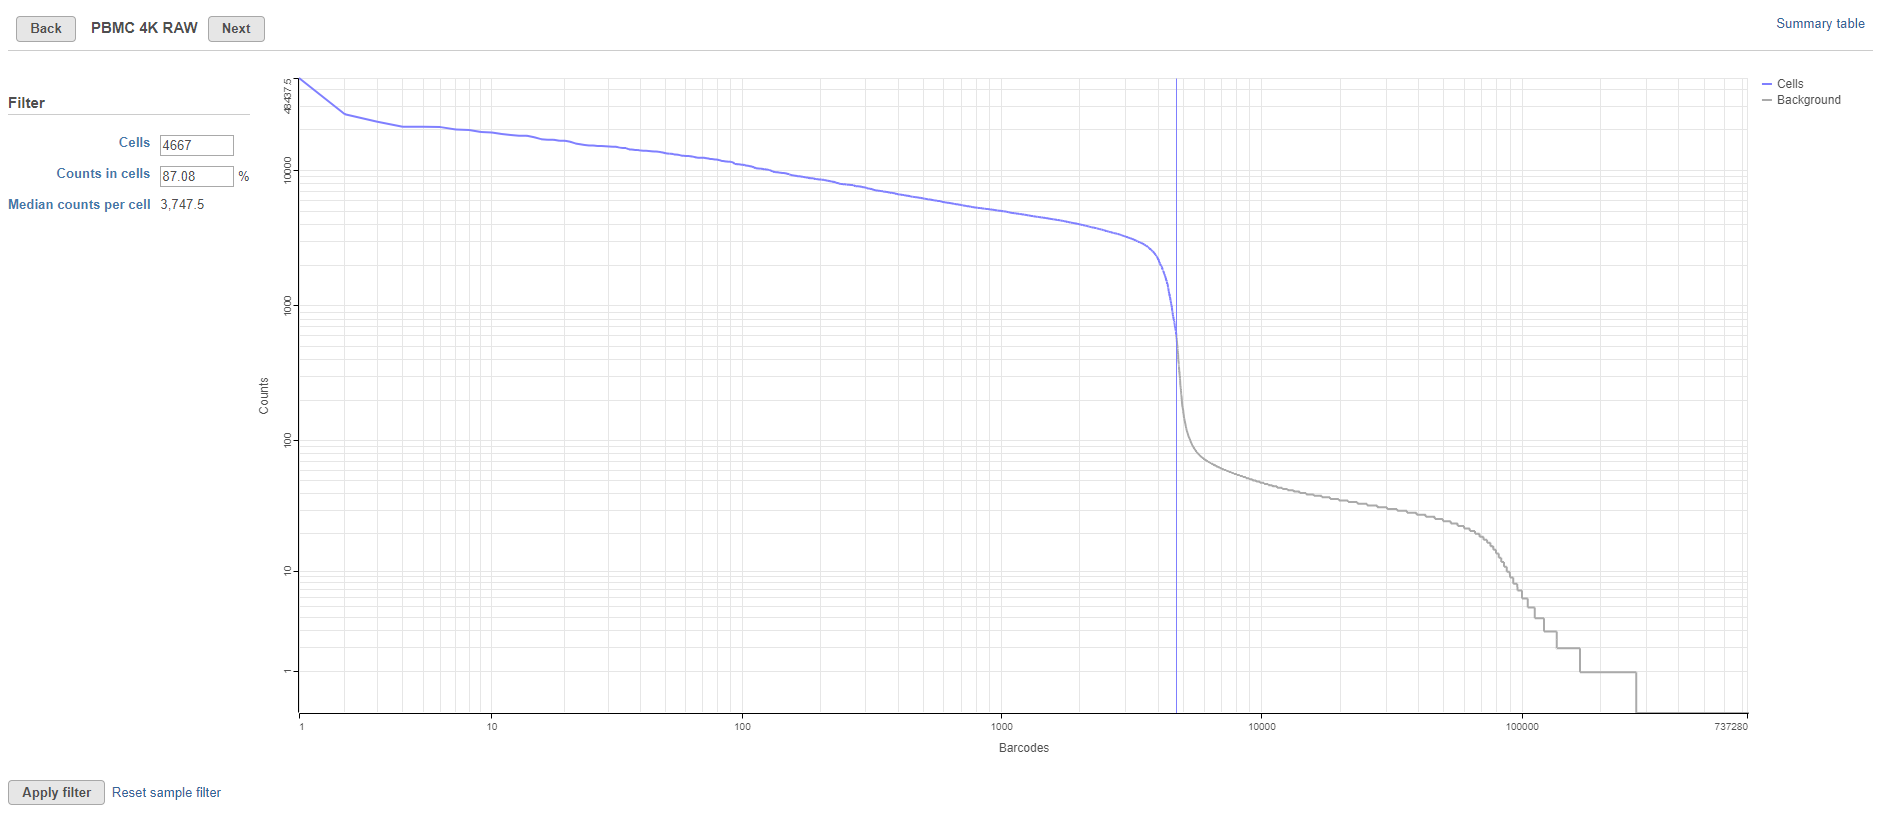 Image Added Image Added
|
The knee plot is used to choose a cutoff point between barcodes that correspond to cells and barcodes that do not. Partek Flow automatically calculates a cutoff point, shown by the vertical line on the graph. Barcodes designated as cells are shown in blue while barcodes designated as without cells (background) are shown in grey.
...
To view a summary of the currently selected filter settings for all samples, click Summary table. This opens a table showing key metrics for each sample in the project (Figure 2).
| Numbered figure captions |
|---|
| SubtitleText | Barcode QA/QC summary table lists filtering information for each sample |
|---|
| AnchorName | Summary table for Barcode QA/QC |
|---|
|
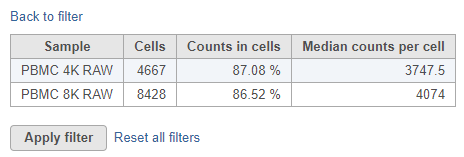 Image Added Image Added
|
To return to the knee plot view, click Back to filter. To apply the filter and run the filter barcodes task, click Apply filter.