...
| Numbered figure captions |
|---|
| SubtitleText | Viewing the filtering options |
|---|
| AnchorName | Filter types |
|---|
|
 Image Removed Image Removed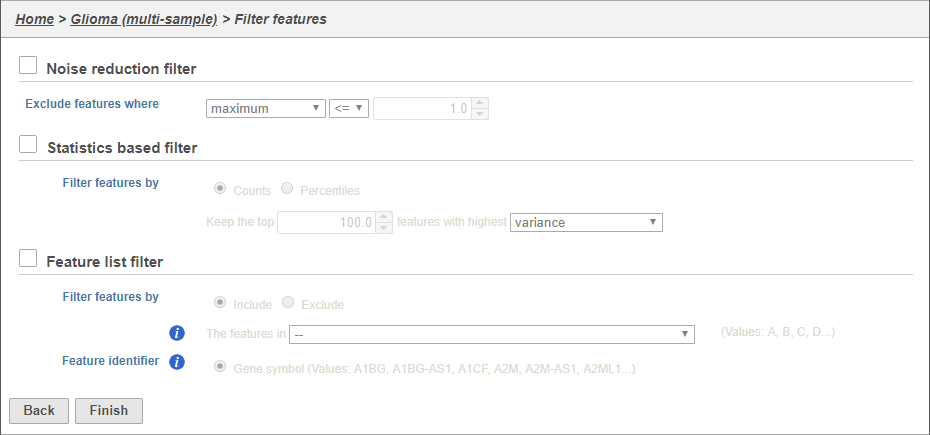 Image Added Image Added
|
The noise reduction filter allows you to exclude genes considered background noise based on a variety of criteria. The statistics based filter is useful for focusing on a certain number or percentile of genes based on a variety of metrics, such as variance. The feature list filter allows you to filter your data set to include or exclude particular genes.
...
- Click the Noise reduction filter check box
- Set the Noise reduction filter to Exclude features where expression value == 0 in 99% of cells using the drop-down menus and text boxes (Figure 16)
- Click Finish to apply the filter
| Numbered figure captions |
|---|
| SubtitleText | Configuring a noise reduction filter to exclude genes not expressed in the data set |
|---|
| AnchorName | Configuring a noise reduction filter |
|---|
|
 Image Removed Image Removed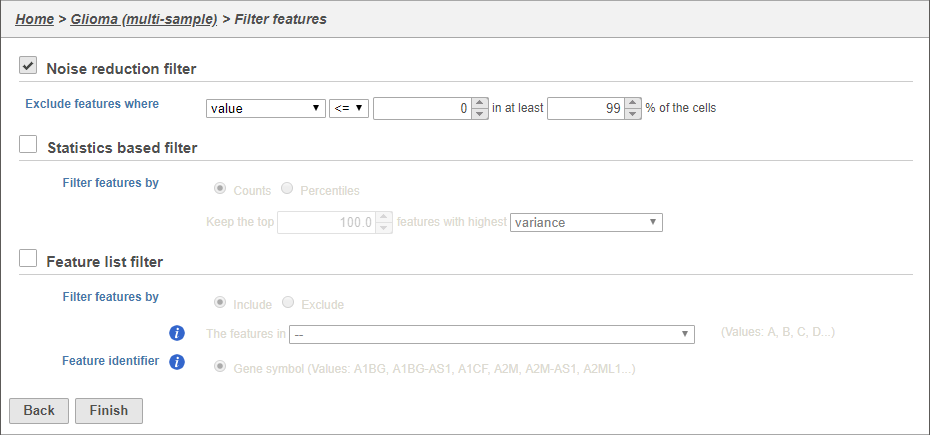 Image Added Image Added
|
This produces a Filtered counts data node. This will be the starting point for the next stage of analysis - identifying cell types in the data using the interactive t-SNE plot.
...