Page History
...
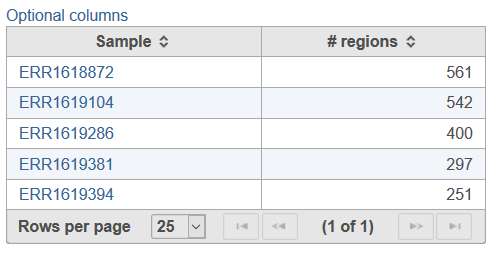
Selecting the Task report for the Copy number data node will provide a table with test samples in the project (non-control) and the number of copy number regions associated with each sample (Figure 2). Selecting Option columns at the top right of the table will allow for attribute columns to be added to the report.
| Numbered figure captions | ||||
|---|---|---|---|---|
| ||||
|
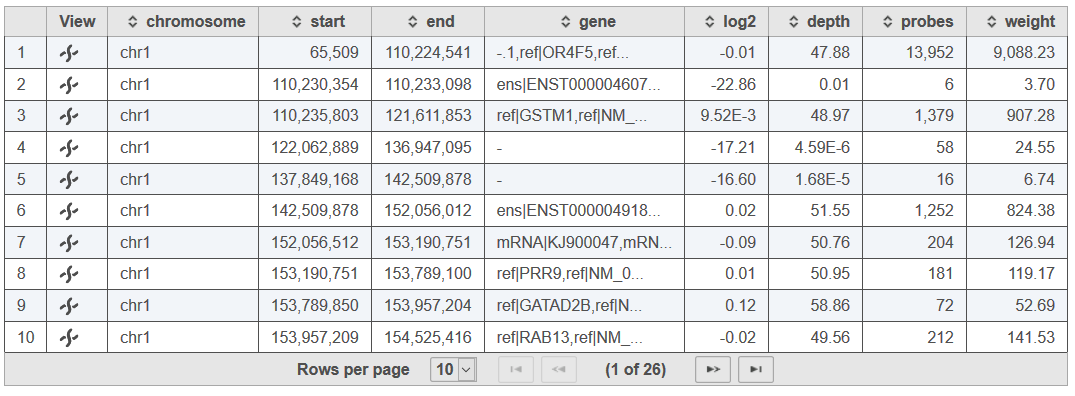
Selecting a sample in the table will open the sample-specific CNVkit report (Figure 3). The sample table will provide a row for each detected region of copy number imbalance in the data with Chromosome, Start and End coordinates. The table also includes the following information:
- gene: content in the copy number region as defined by the associated Target regions or Annotation file
- log2: the weighted log2 mean coverage depth across all bins in the segment
- depth: the weighted mean of absolute-scale mean coverage depth for bins in the segment
- probes: the number of bins covered by the segment
- weight: the sum of bin level weights for the segment that denotes reliability based upon bin size and the square of the log2 spread in the pooled reference
| Numbered figure captions | ||||
|---|---|---|---|---|
| ||||
|
...
Overview
Content Tools