Page History
Analysis of The list, LCLs vs B cells, includes differentially methylated loci in humans and mice typically includes exclusion of the probes on X and Y chromosomes because of the difficulties caused by the inactivation of one X chromosome in female samples. To filter out probes from the X and Y chromosomes, we first need to annotate the ANOVA spreadsheet with chromosome locations.for locations across the genome; however, in many cases we may want to focus on loci located in particular regions of the genome. To filter our list to include only regions of interest, we can use the annotations provided by Illumina and the interactive filter in Partek Genomics Suite.
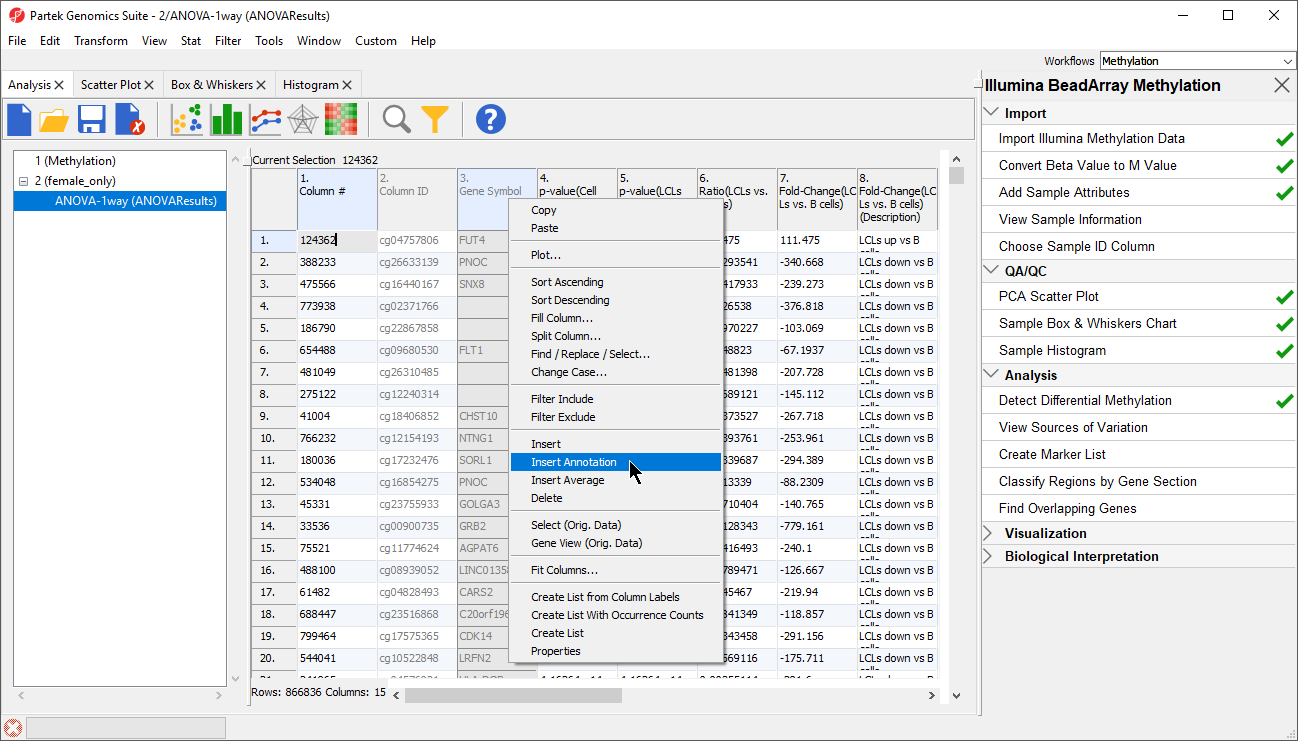
- Select LCLs_Vs_B_cells from the spreadsheet tree
- Right-click on the Gene Symbol column
- Select Insert Annotation (Figure 1)
| Numbered figure captions | ||||
|---|---|---|---|---|
| ||||
|
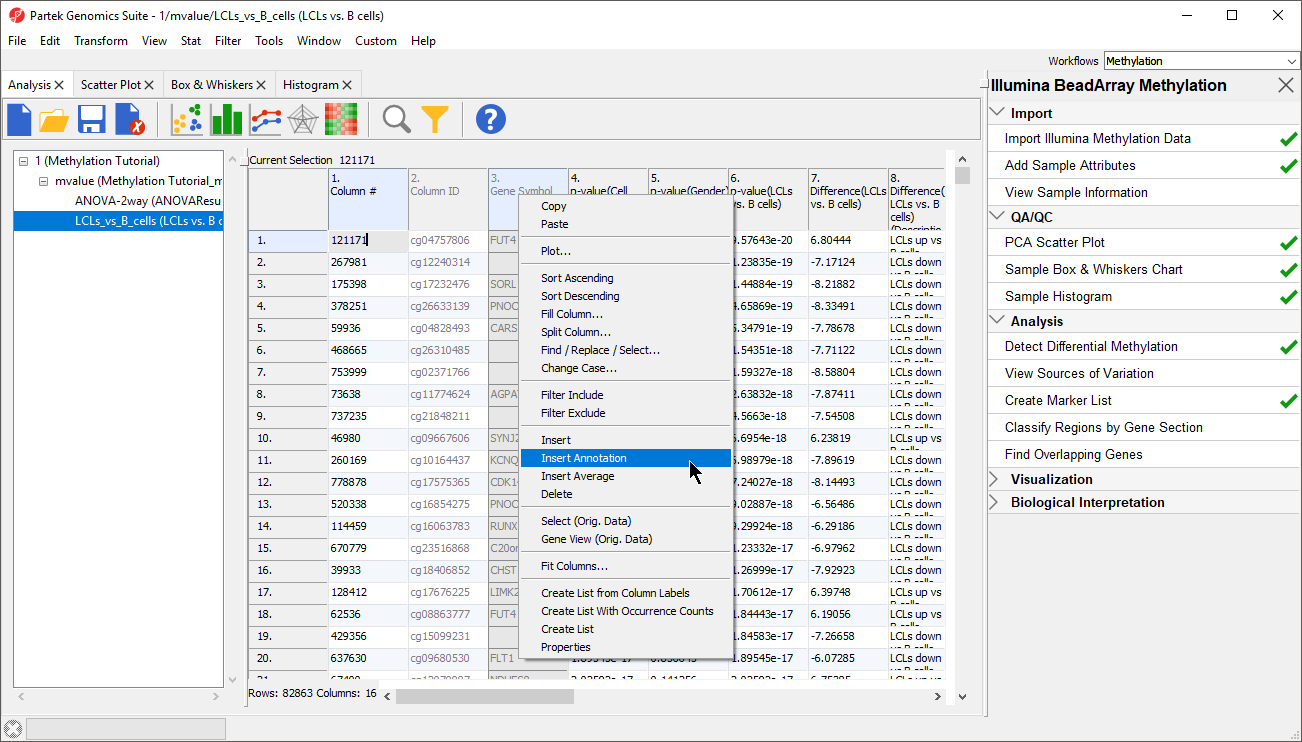
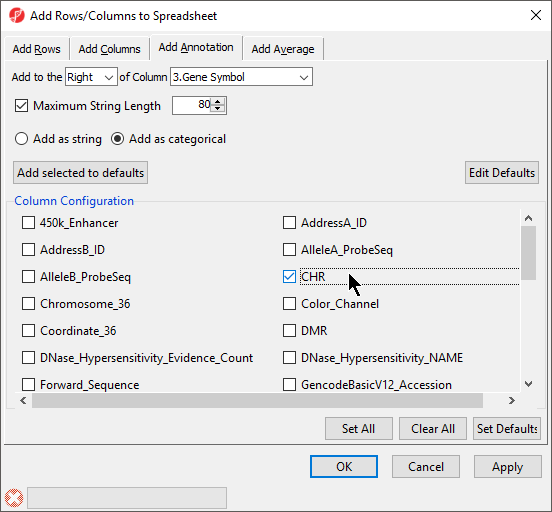
- Select the Add as categorical option
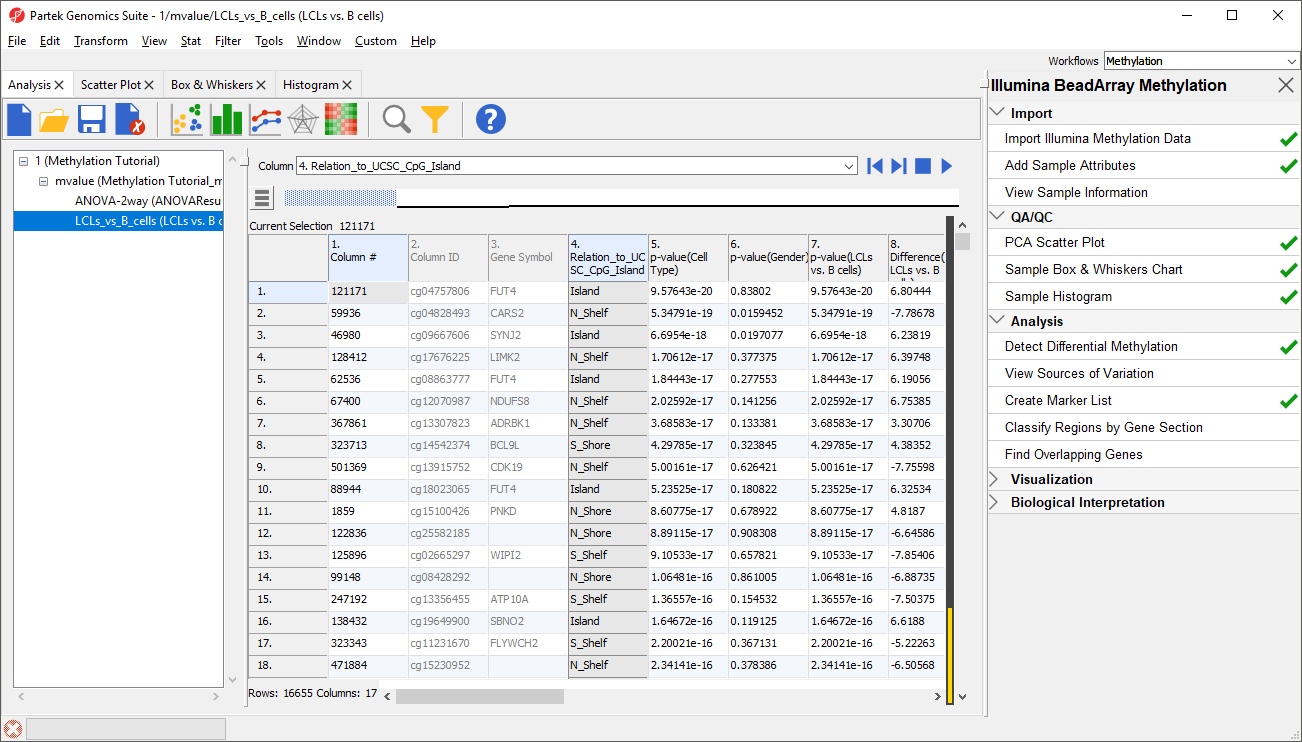
- Select CHRRelation_to_UCSC_CpG_Island (Figure 2)
CpG islands are regions of the genome with an atypically high frequency of CpG sites. CpG islands and their surrounding regions (termed shelf and shore) include many gene promoters and altered methylation in these regions can have a disproportionate effect on gene expression. For example, altered methylation of promoter CpG islands is a common mechanism for gene expression changes in cancer.
| Numbered figure captions | ||||
|---|---|---|---|---|
| ||||
|
- Select OK to add chromosome add Relation_to_UCSC_CpG_Island as a column in next to 3. Gene Symbol
- Select (
 ) from the quick action bar to save the ANOVA-1way 2way (ANOVA Results) spreadsheet with the added annotation
Now, we can filter probes by chromosome locationtheir relation to CpG islands.
- Select (
 ) from the quick action bar to invoke the interactive filter
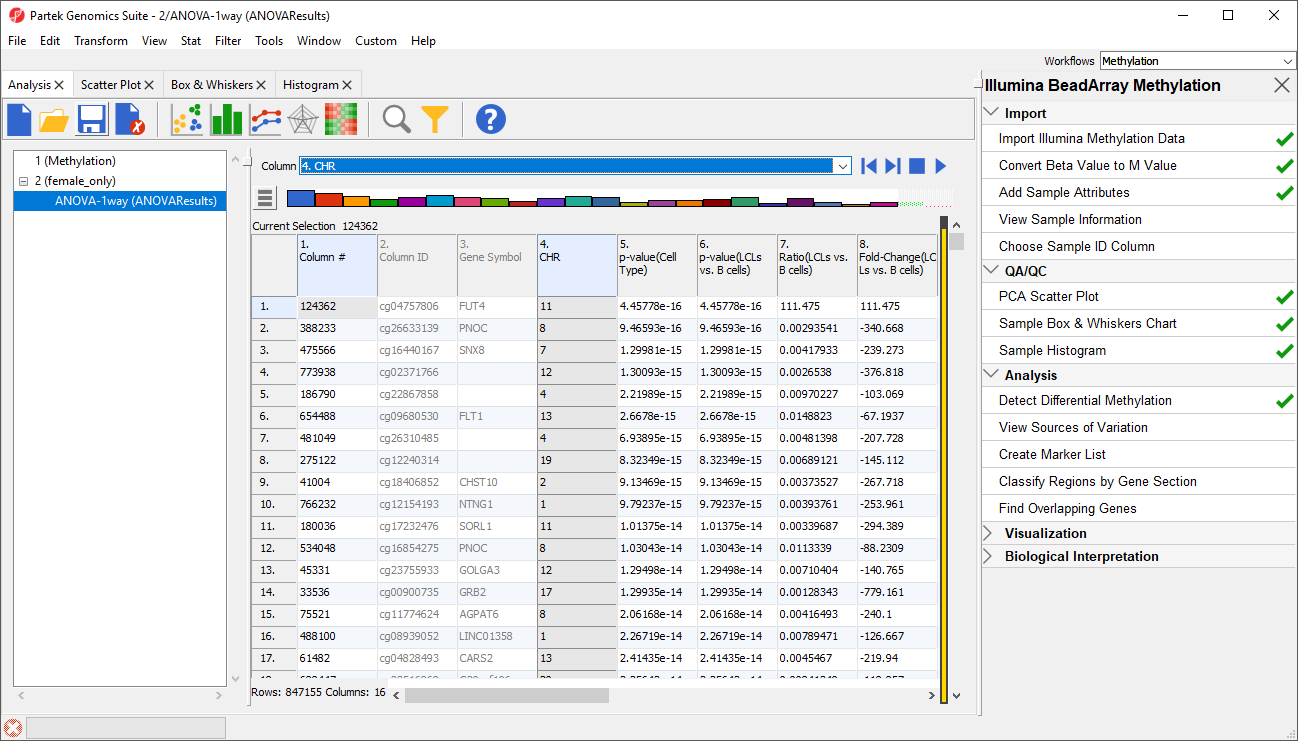
 - Select 4. CHR Relation_to_UCSC_CpG_Island for Column
For categorical columns, the interactive filter displays each category of the selected column as a colored bar. For 4. CHRRelation_to_UCSC_CpG_Island, each bar represents a chromosome with the height of bar representing the number of probes from that chromosome in the selected spreadsheetone of the categories of the UCSC annotation . To filter out a category, left-click on its bar. Right clicking on a bar will include only the selected category. A pop up balloon will show the category label as you mouse over each bar.
- Left-click the X and Y chromosome columns unlabeled column to filter them it out (Figure 3)
| Numbered figure captions | ||||
|---|---|---|---|---|
| ||||
|
The yellow and black bar on the right-hand side of the spreadsheet panel shows the fraction of excluded cells in black and included cells in yellow. Right-clicking this bar brings up an option to clear the filter.
Now that we have filtered out probes on the X and Y chromosomesthat are not in or near CpG islands, we will create a spreadsheet containing only these probes on the autosomes.
- Right click on the ANOVA-1way (ANOVAResults)the LCLs vs. B cells spreadsheet in the spreadsheet tree panel (Figure 4)
| Numbered figure captions | ||||
|---|---|---|---|---|
| ||||
|
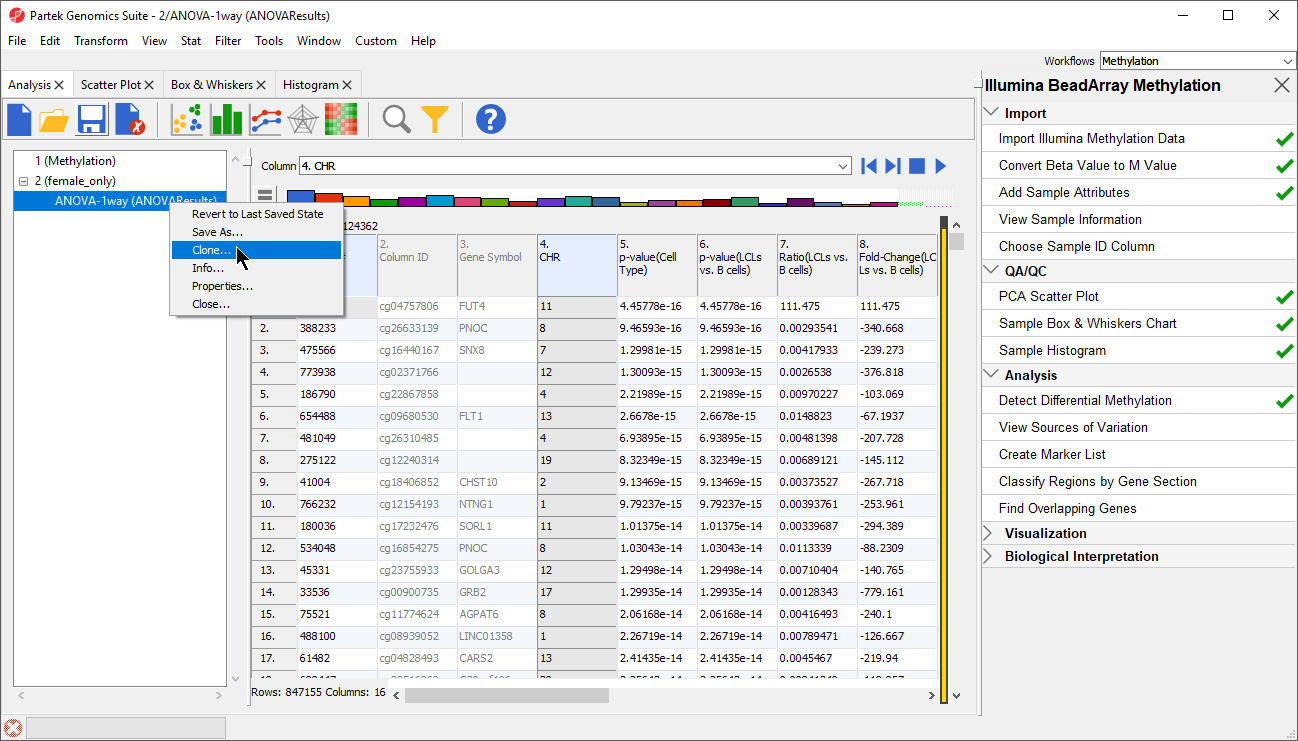
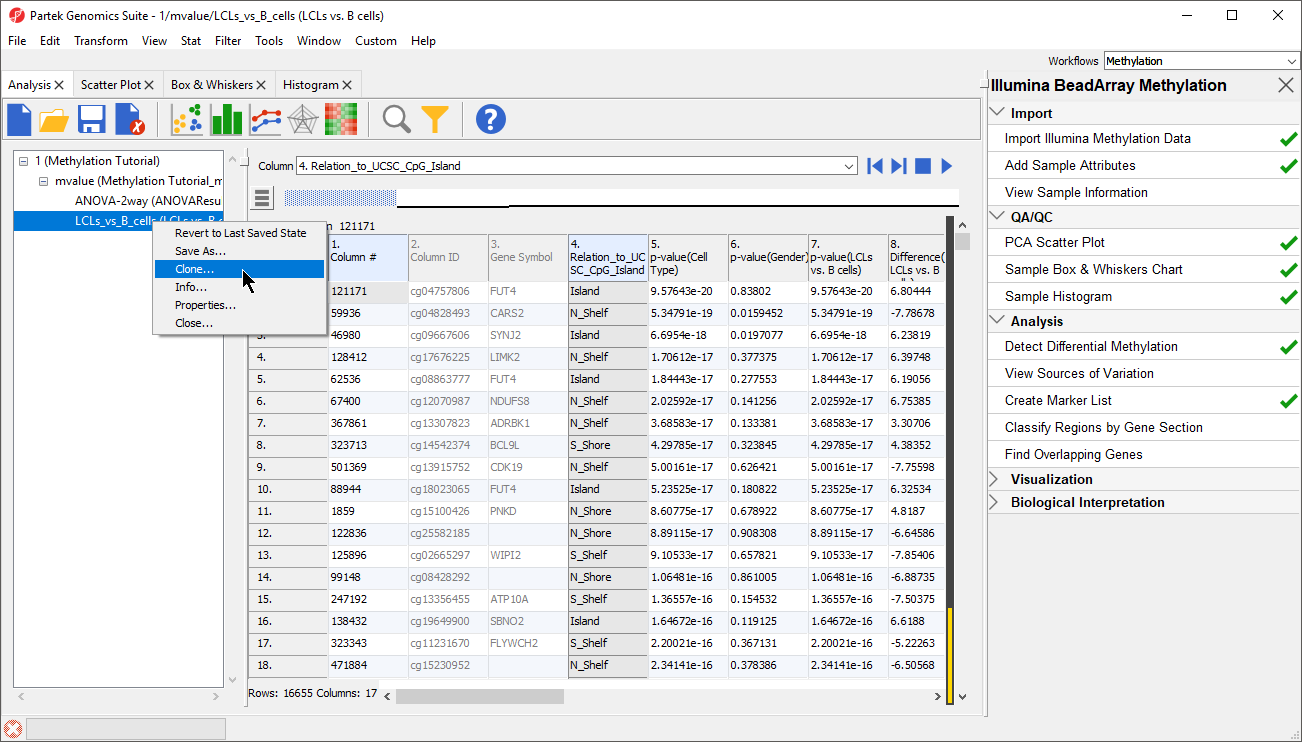
- Select Clone
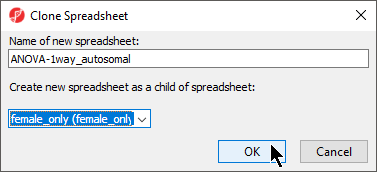
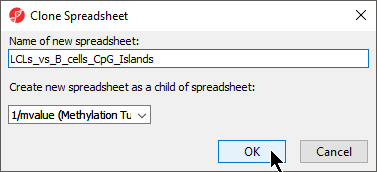
- Rename the new spreadsheet ANOVA-1way_autosomal LCLs_vs_B_cells_CpG_Islands using the Clone Spreadsheet dialog
- Select female_only mvalues from the Create new spreadsheet as a child spreadsheet: drop-down menu (Figure 5)
- Select OK
| Numbered figure captions | ||||
|---|---|---|---|---|
| ||||
|
- Select () from the quick action bar to save the filtered spreadsheet
- Specify a name for the spreadsheet, we chose autosomalLCLs_vs_B_cells_CpG_Islands, using the Save File dialog
- Select Save to save the spreadsheet
...
Overview
Content Tools