Page History
...
Starting with copy number estimates for each marker (either taken directly from the vendor’s input file or calculated previously), the goal is to derive a list of regions where adjacent markers share the same copy number.
Choosing a method for copy number detection
There are two algorithms available for copy number region detection: Genomic Segmentation and Hidden Markov Model (HMM). Both algorithms look for trends across multiple adjacent markers. The genomic segmentation algorithm identifies breakpoints in the data, i.e., changes in copy number between two neighboring regions. The HMM algorithm looks for discrete changes of whole number copy number states (e.g., 0, 1, 2 … with no upper limit) and will find regions with those numbers of copies. Therefore, the HMM model performs better in cases of homogeneous samples where copy numbers can be anticipated such as clinical syndromes with underlying copy number aberrations. Genomic segmentation is preferable for heterogeneous samples with unpredictable copy numbers such as cancer because tumor biopsies often contain “contaminating” healthy tissue and cancer cells can have heterogeneous copy number aberrations.
Detecting amplifications and deletions with Genomic Segmentation
The number of copies of each marker created in the previous step will be used to detect the genomic regions with copy number variation, i.e., to identify amplifications and deletions across the genome.
...
If desired, you can use the Merge Adjacent Regions under Tools in the main toolbar to combine similar regions.
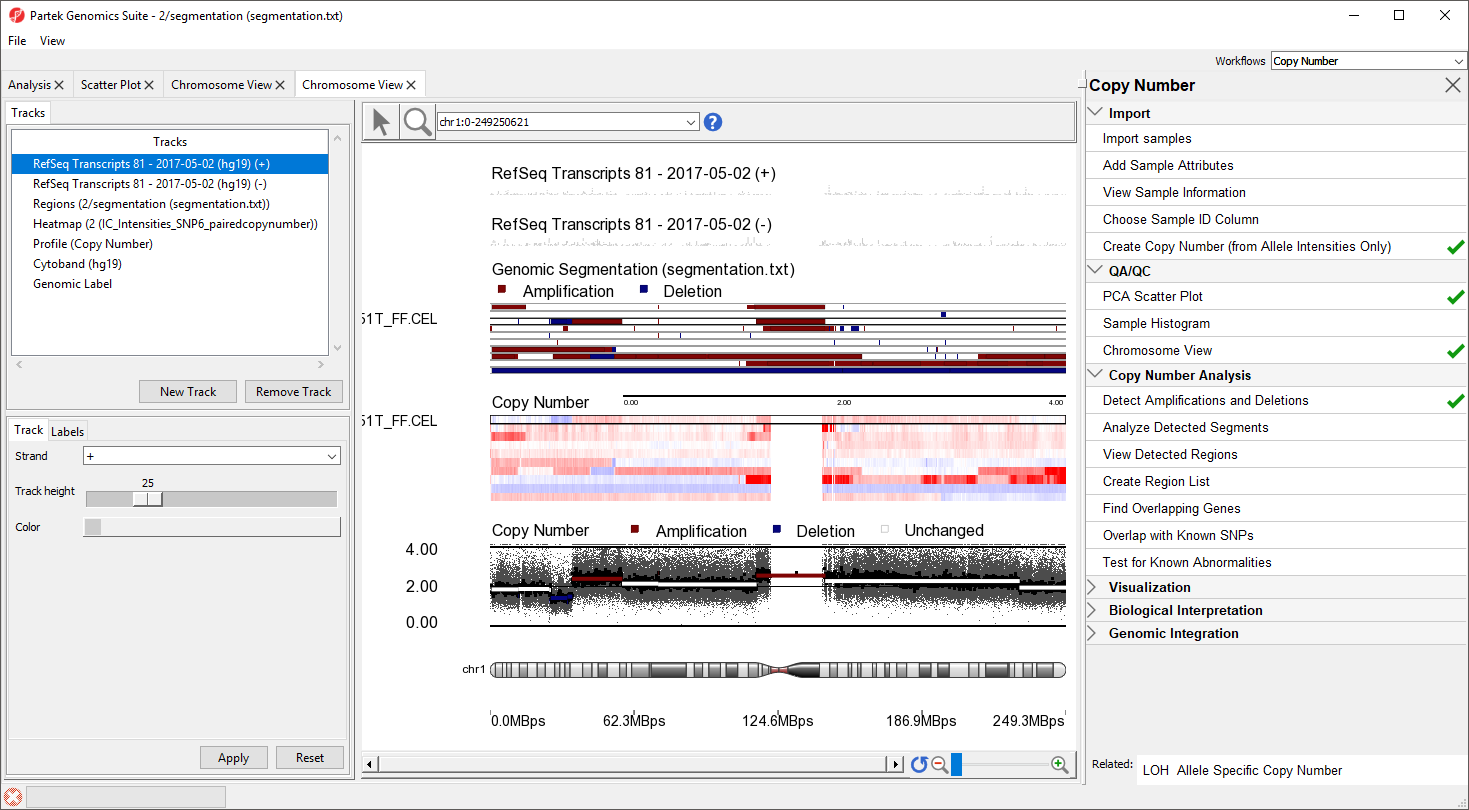
Visualizing regions of interest
Individual regions of interest can be visualized using Chromosome View.
...
| Numbered figure captions | ||||
|---|---|---|---|---|
| ||||
|
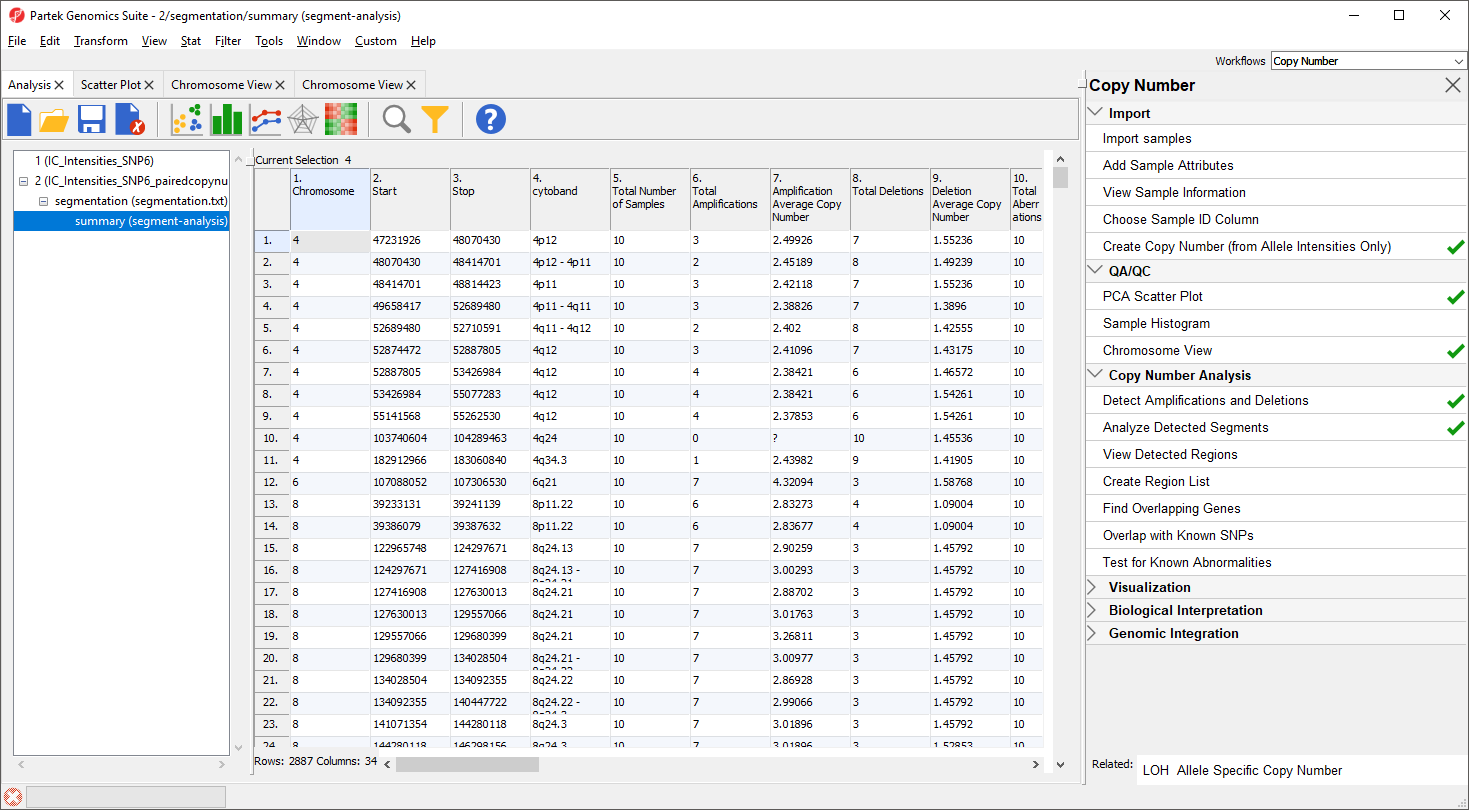
Analyzing shared regions of copy number variation
Once regions with amplification and deletion in each sample have been detected, we can compare the regions across multiple samples to detect copy number changes that are shared by multiple samples.
...
| Numbered figure captions | ||||
|---|---|---|---|---|
| ||||
|
Visualizing shared regions of copy number variation
To get an overiew of the common abberations in the group of samples over the entire genome, there are two helpful visualizations that are accessed through View Detected Regions.
...
Overview
Content Tools