Page History
| Table of Contents | ||||||
|---|---|---|---|---|---|---|
|
With a list of amplified or deleted regions in our cohort in hand, one of the more interesting questions to ask is what genes have recurrent amplifications or deletions in the data set. To address this question, we can use the Fine overlapping genes function to either add a column to our region list with the genes present in each region or create a new list of genes that overlap the regions.
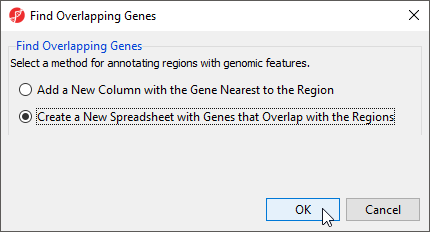
Here, we will create a new spreadsheet with genes that overlap the regions in the amplified_or_deleted spreadsheet.
- Select the amplified_or_deleted spreadsheet in the spreadsheet tree
- Select Find Overlapping Genes from the Copy Number Analysis section of the workflow
- Select Create a new spreadsheet with genes that overlap the regions from the Find Overlapping Genes dialog (Figure 1)
- Select OK
| Numbered figure captions | ||||
|---|---|---|---|---|
| ||||
|
To determine what regions in the genome correspond to genes, we need to select an annotation database (Figure 2).
| Numbered figure captions | ||||
|---|---|---|---|---|
| ||||
|
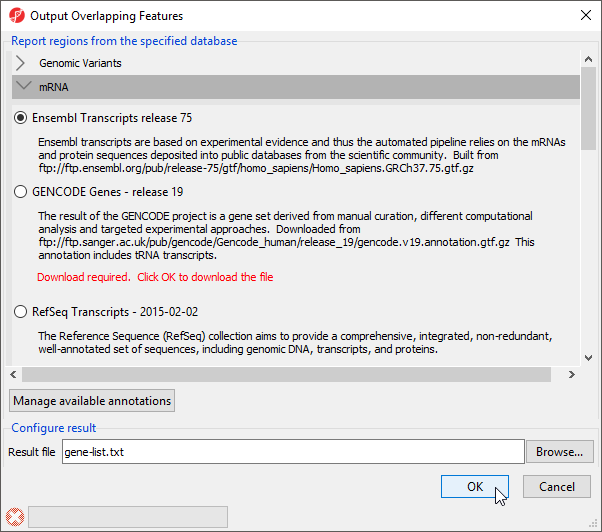
- Select Ensembl Transcripts release 75
- Select OK
A new spreadsheet, gene-list, is created as a child spreadsheet of amplified_or_deleted (Figure 3).
| Numbered figure captions | ||||
|---|---|---|---|---|
| ||||
|
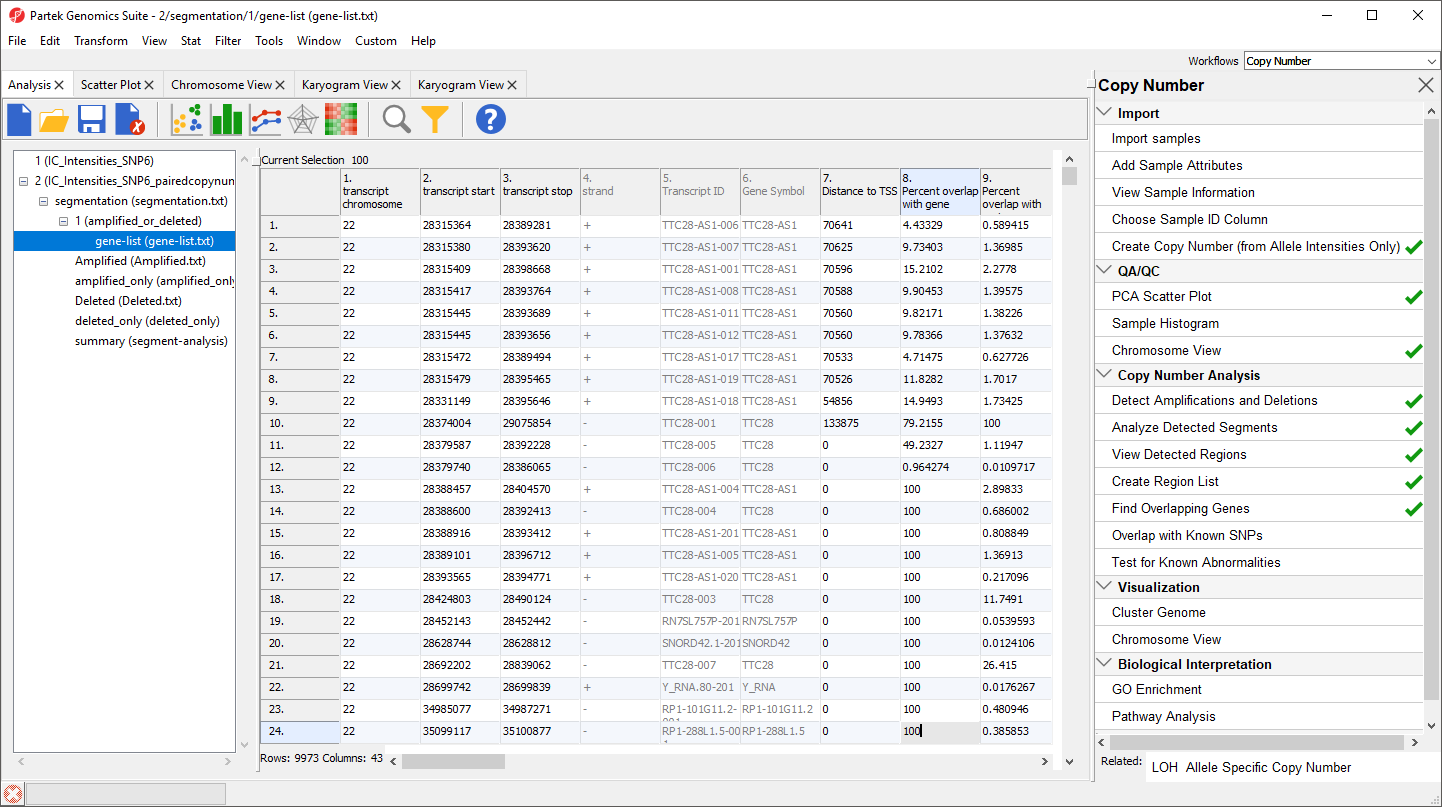
Each row corresponds to a transcript and the columns are as follows:
1. Genomic coordinates of the transcript
4. Coding strand
5. Transcript ID
6. Gene Symbol
7. Minimum distance of the region to the transcription start site with positive values indicating downstream and negative values indicating upstream
8. Percent overlap with gene indicates how much of the transcript sequence overlaps the region
9. Percent overlap with region indicates how much of the region is overlapped by the transcript
10. + Correspond to the columns 1+ in the segment-analysis spreadsheet
This gene-list spreadsheet is gene-centric and enable genomic integration. For example, GO and Pathway encihment can be diretly invoked on the gene-list spreadsheet to detect the functional groups affected by copy number changes. Fo rmore information on GO Enrichment analysis, please see the Gene Ontology Enrichment tutorial.
Another interesting use of this spreadsheet is to find possible fusion genes. If only a fraction of the gene as been amplified or deleted (column 8. Percent overlap with gene), it is possible that a translocation event took place and split the gene.
| Page Turner | ||
|---|---|---|
|
| Additional assistance |
|---|
|
| Rate Macro | ||
|---|---|---|
|
Overview
Content Tools