Page History
...
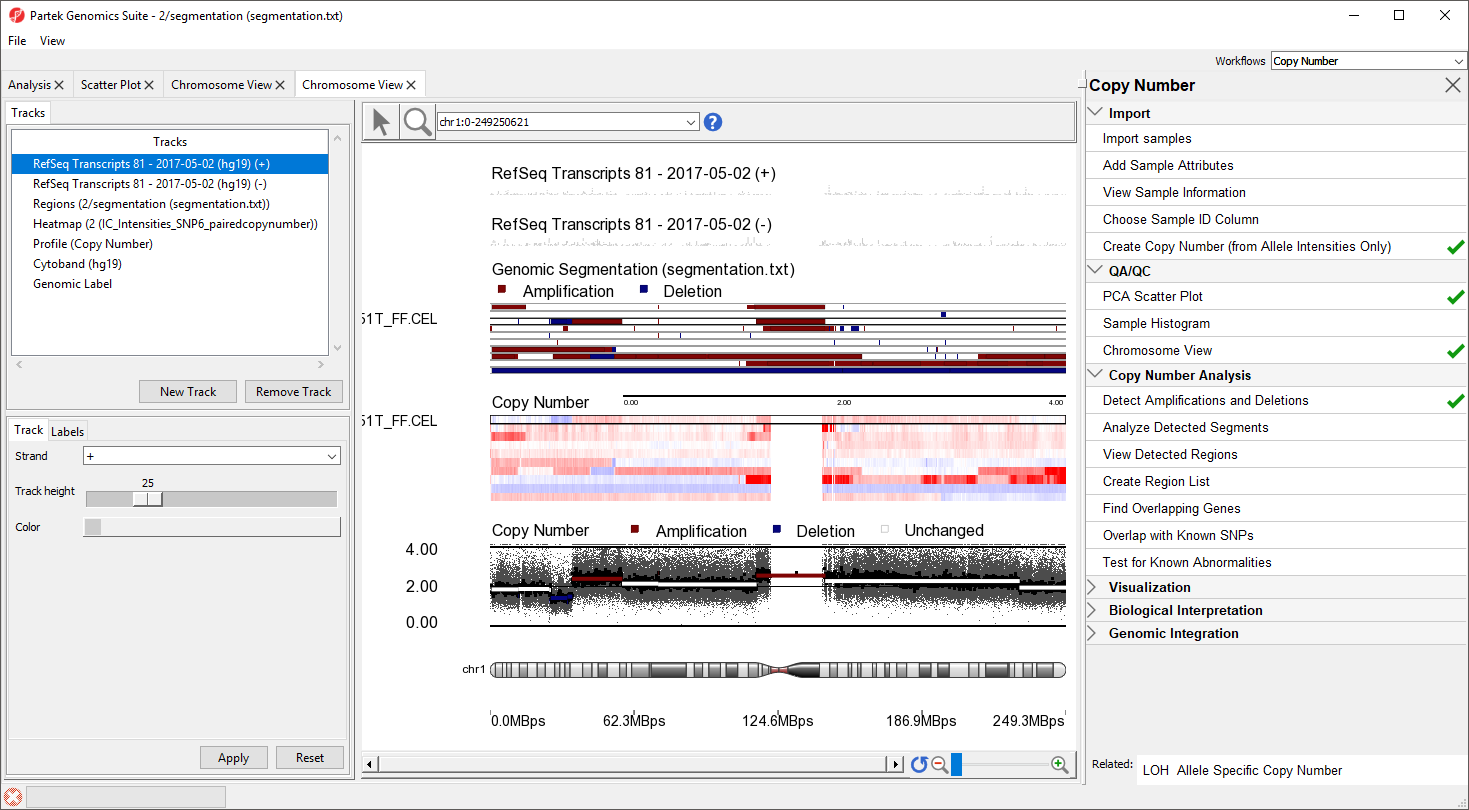
The Genomic Segementation track displays the segmentation results (Figure 5). Each line in the track represents a smaple. Amplified, deleted, and unchanged regions are shown in red, blue, and white, respectively. The Profile track now also includes information from the segmentation spreadsheet ffor the selected sample.
| Numbered figure captions | ||||
|---|---|---|---|---|
| ||||
|
...
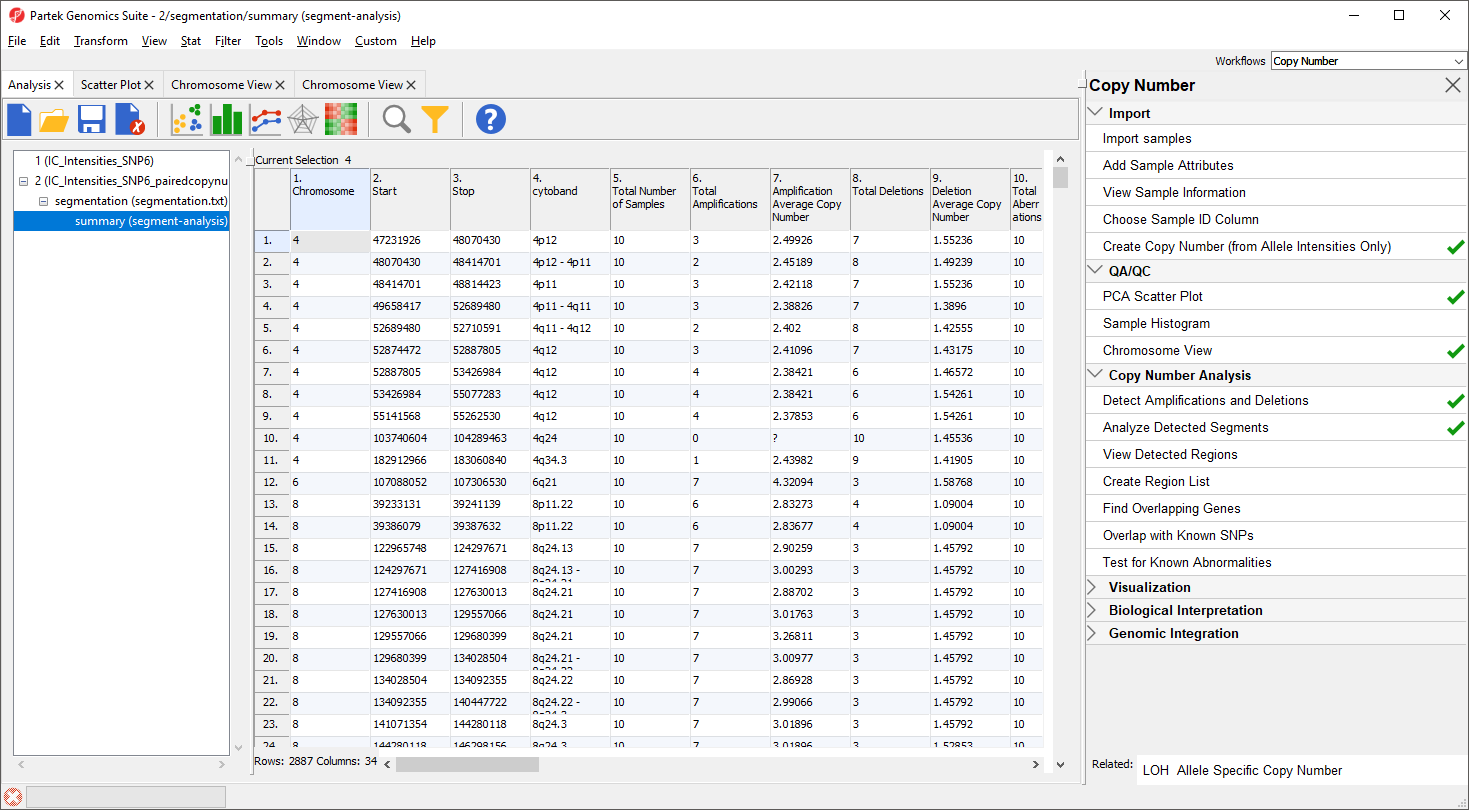
15+. Two columns per sample - the average copy number in each sample as well as the copy number change status of the sample sample (e.g., amplified, deleted, unchanged, depending on the copy number and the threshold for unchanged defined in the Genomic Segementation dialog)
A "?" indicates that a region with the particular characterisitic does not exist or cannot be computed. For example, if a region is not amplified in any of the samples, the average amplified copy number will be shows as "?". This list may be filtered to contain only region that meet user-specified criteria as discussed in the next section of the tutorial.
| Numbered figure captions | ||||
|---|---|---|---|---|
| ||||
|
Visualizing shared regions of copy number variation
To get an overiew of the common abberations in the group of samples over the entire genome, there are two helpful visualizations that are accessed through View Detected Regions.
| Additional assistance |
|---|
|
| Rate Macro | ||
|---|---|---|
|
Overview
Content Tools