Page History
...
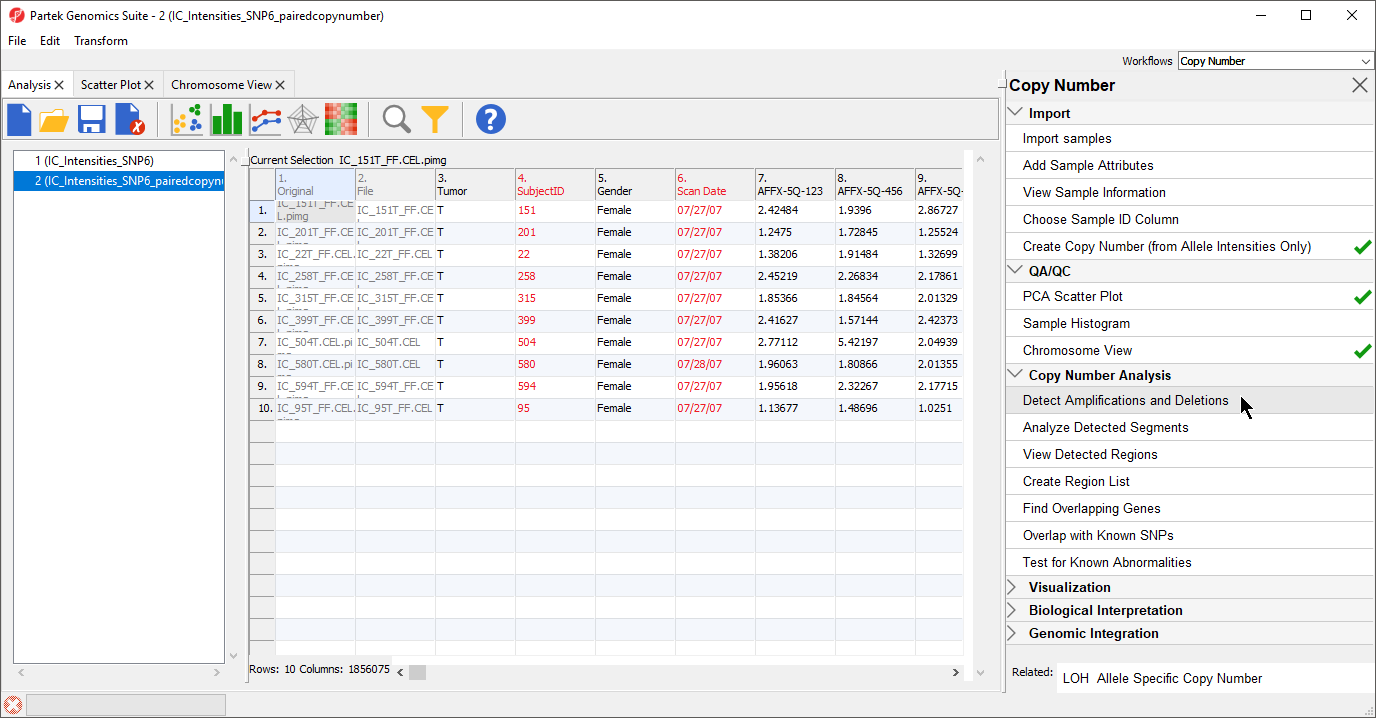
- Select the IC_IntensitiesSNP6pairedcopynumber spreadsheet in the Analysis tab
- Select Detect Amplifications and Deletions from the Copy Number Analysis section of the workflow (Figure 1)
| Numbered figure captions | ||||
|---|---|---|---|---|
| ||||
|
The Detect Amplifications and Deletions dialog will give you the option to choose Genomic Segmentation or HMM Region Detection (Figure 2).
| Numbered figure captions | ||||
|---|---|---|---|---|
| ||||
|
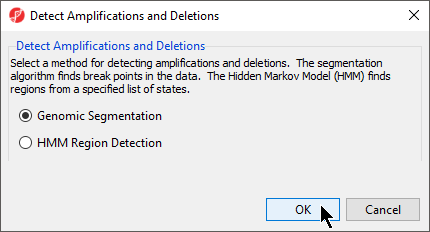
- Select Genomic Segmentation
- Select OK
The Genomic Copy Number Segmentation dialog gives options for setting segmentation parameters and the configuring the region report (Figure 3).
| Numbered figure captions | ||||
|---|---|---|---|---|
| ||||
|
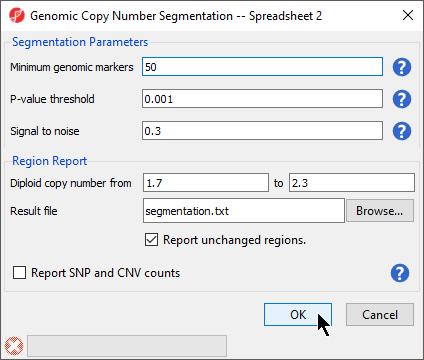
- Set Minimum genomic markers to 50
- Leave the rest of the parameters set to default values as shown (Figure 3)
- Select OK
The Genomic Segmentation task is divided into two steps. In the first step, each region is compared to an adjacent region to determine whether both have the same average copy number and whether a breakpoint can be inserted. This task determines this by using a two-sided t-test to compare the average intensities of adjacent regions and then checks whether the corresponding cut-off p-value is below the specified P-value threshold. The genomic size of a region is defined by the numbe rof gneomic markers in the region (Minimum genomic markers), while the magnitude of the significant difference between two regions is controlled by Signal to noise, which can be thought of, if simplified, to be the difference in copy numbers between the regions. If the t-test is significant, ithe copy number of the region differs significantly from its nearest neighbors. However, a second step is needed to detemine whether the difference is due to amplificaiton or deletion. In this second stage, two one-sided t-tests are used to copare the mean copy number in the region with the expected (normal) diploid copy number. For a detailed explanation of the genomic segmenetation procedure, please consult our Genomic Segmentation white paper. For more detailed information about fine-tuning the parameters of your copy number analysis, please consult our guide, Optimizing Copy Number Segmentation.
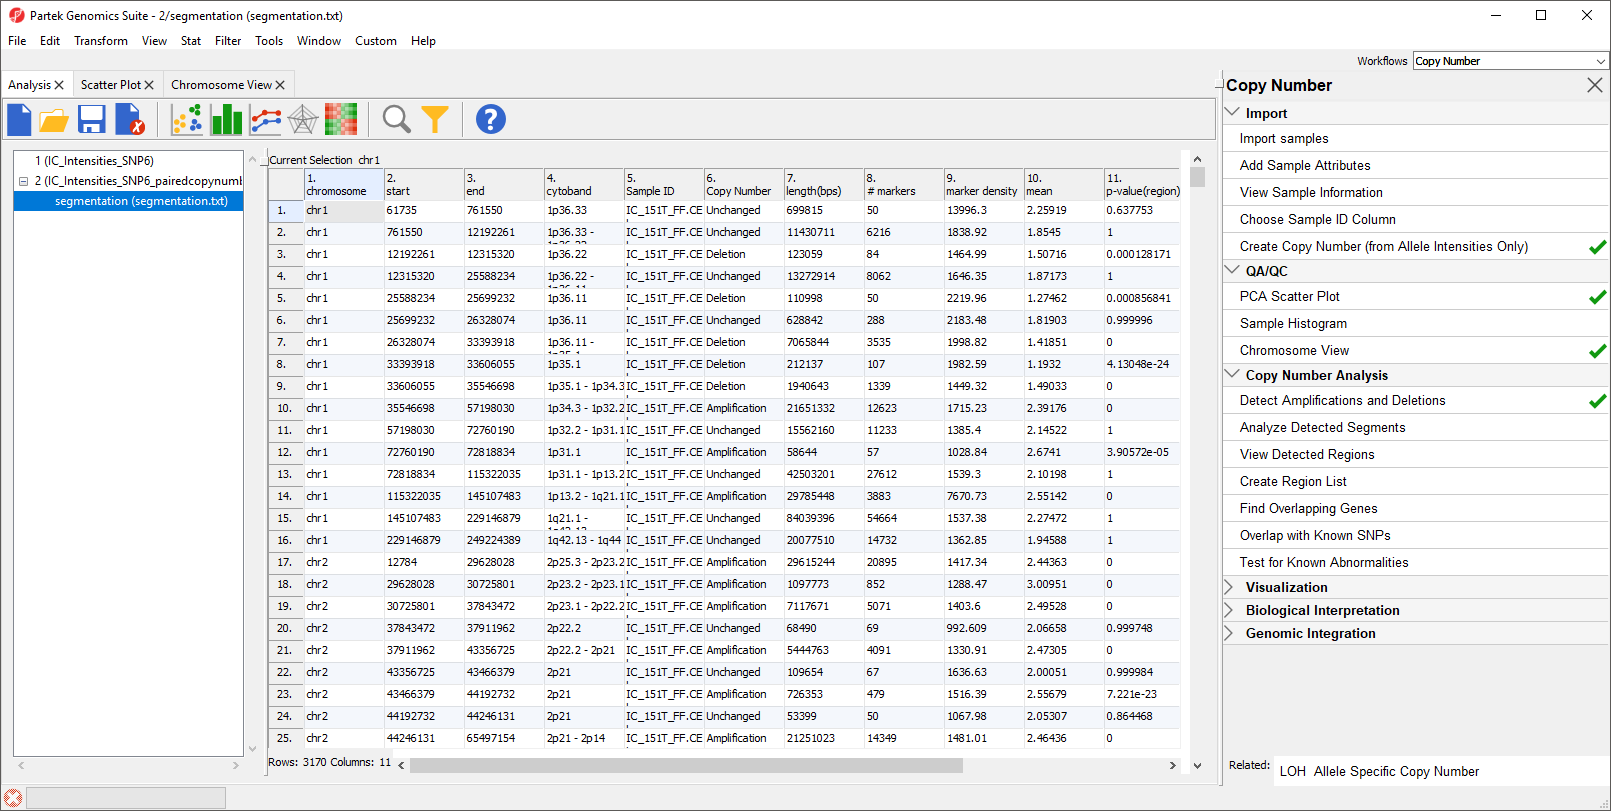
The resulting spreadsheet, segmentation, shows one row per genomic region per sample (Figure 4). The columns provide the following information:
1-4: Genomic location of the region
5. Sample ID
6. Description of the copy number change
7. The length of the region (in base pairs)
8. The number of markers in the region
9. Markers density in the region (region length in base pairs divided by the number of markers)
10. Geometric mean of the copy number of all the markers in the region
11. Minimum p-value of the one-sided t-tests of the difference of the copy number in column 10 vs. the diploid range
| Numbered figure captions | ||||
|---|---|---|---|---|
| ||||
|
If desired, you can use the Merge Adjacent Regions under Tools in the main toolbar to combine similar regions.
To
| Additional assistance |
|---|
|
| Rate Macro | ||
|---|---|---|
|
Overview
Content Tools