Page History
...
For this example, we will use the data set and lists created in the Gene Expression tutorial. We have a list of 23 genes that we have identified as are differentially regulated between in tissue samples from patients with Down Syndrome syndrome and normal controls. We want to display the mean intensity values for Down Syndrome syndrome and normal samples for each of the 23 genes on a single plot. To do this, we first need to filter the probe intensities spreadsheet to include only the intensity values for the 23 genes of interest.
...
- Select the probe intensities spreadsheet in the spreadsheet tree; here, it is Down_Syndrome-GE
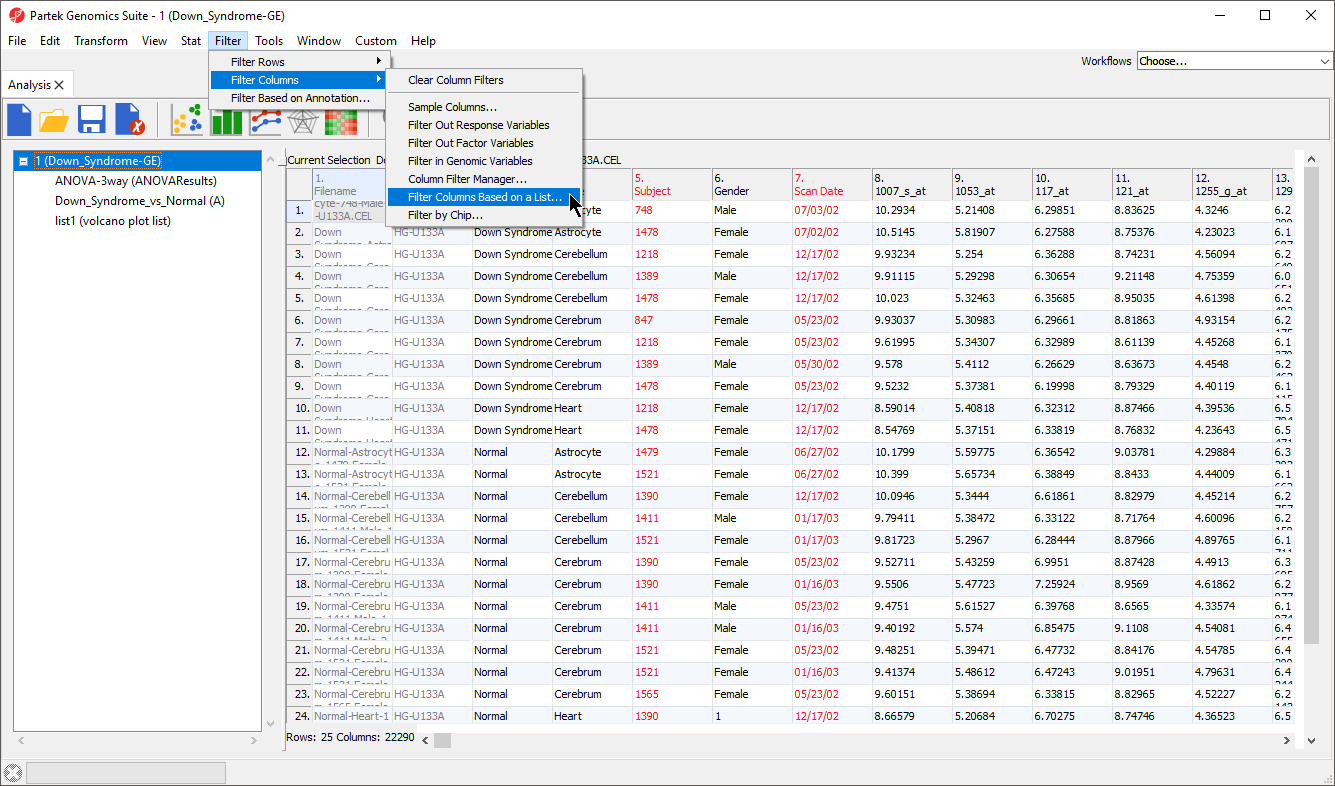
- Select Filter from the main task bar
- Select Filter Columns
- Select Filter Columns Base on a List... (Figure 1)
| Numbered figure captions | ||||
|---|---|---|---|---|
| ||||
|
...
Overview
Content Tools