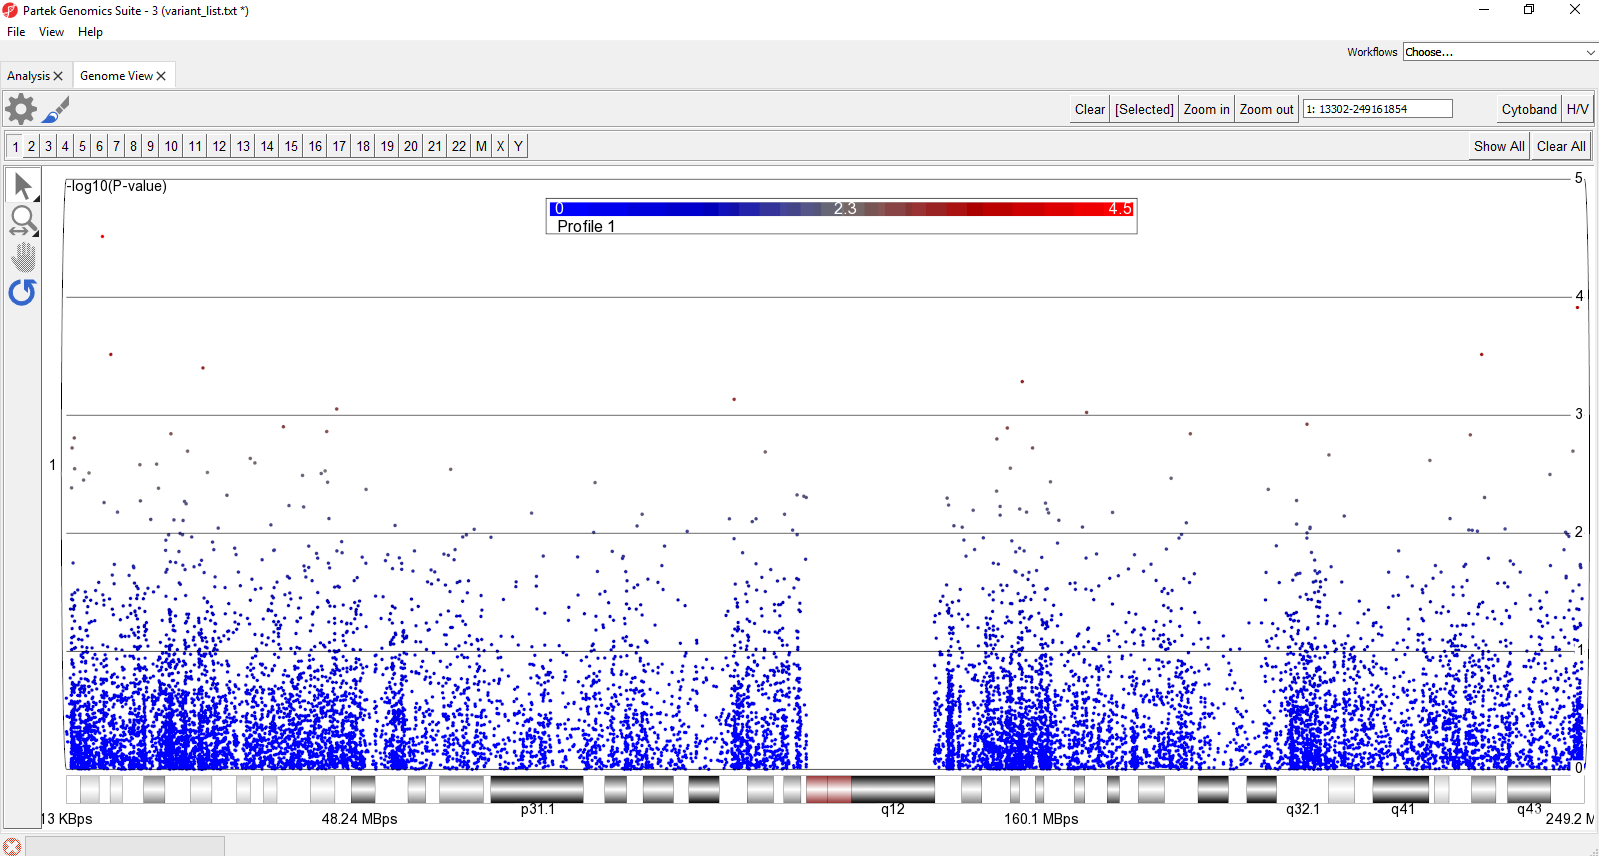
The plot will now show a Manhattan plot (Figure 1).
Numbered figure captions
SubtitleText
Customized Genome View showing genomic locations on the x-axis and -log10(P-values) of SNPs on the y-axis (Manhattten plot). Each dot represents a single SNP. The Cytoband is shown along the bottom of the plot