Page History
| Table of Contents | ||||||
|---|---|---|---|---|---|---|
|
Once a list of genes has been created, it is possible to see which functional groups the genes fall into as well as how well represented these differentially expressed genes are in the functional groups. Gene Ontology (GO) enrichment analysis compares a gene list to lists of genes associated with biological processes, cellular compartments, and molecular functions to provide biological insights.
- Select the E2 vs. Control spreadsheet from the spreadsheet tree
- Select Gene Set Analysis from the Biological Interpretation section of theGene Expression workflow
- Select Next > to continue with GO Enrichment
- Select Next > to continue with 1/E2_vs_Control (E2 vs. Control)
- Select Next > to continue with default parameter settings
- Select Next > to continue with the default mapping file
A new spreadsheet 1 (GO-Enrichment.txt) will open as a child spreadsheet of E2 vs. Control (Figure 1).
| Numbered figure captions | ||||
|---|---|---|---|---|
| ||||
|
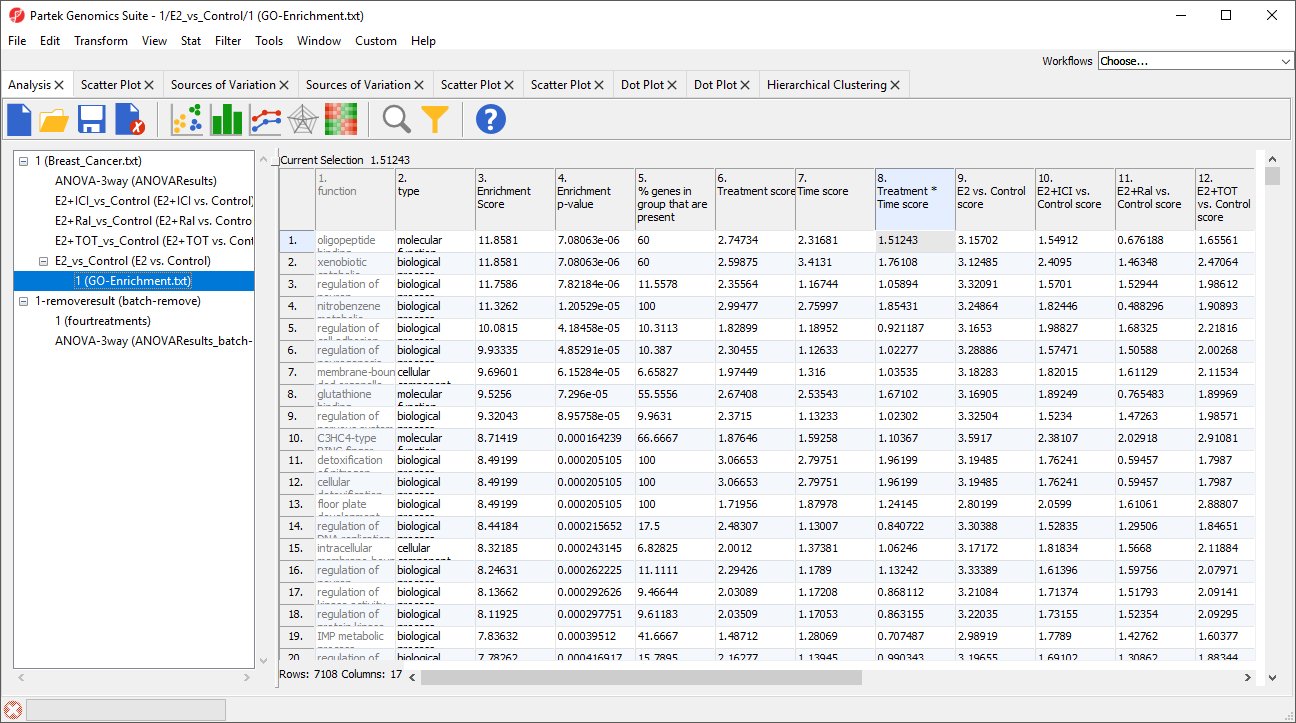
GO terms are shown in rows and are sorted by ascending enrichment p-value by default.
To visualize the results, we can launch the Gene Ontology Browser.
- Select View from the main tool bar
- Select Gene Ontology Browser
The Gene Ontology Browser will open in a new tab (Figure 2).
| Numbered figure captions | ||||
|---|---|---|---|---|
| ||||
|
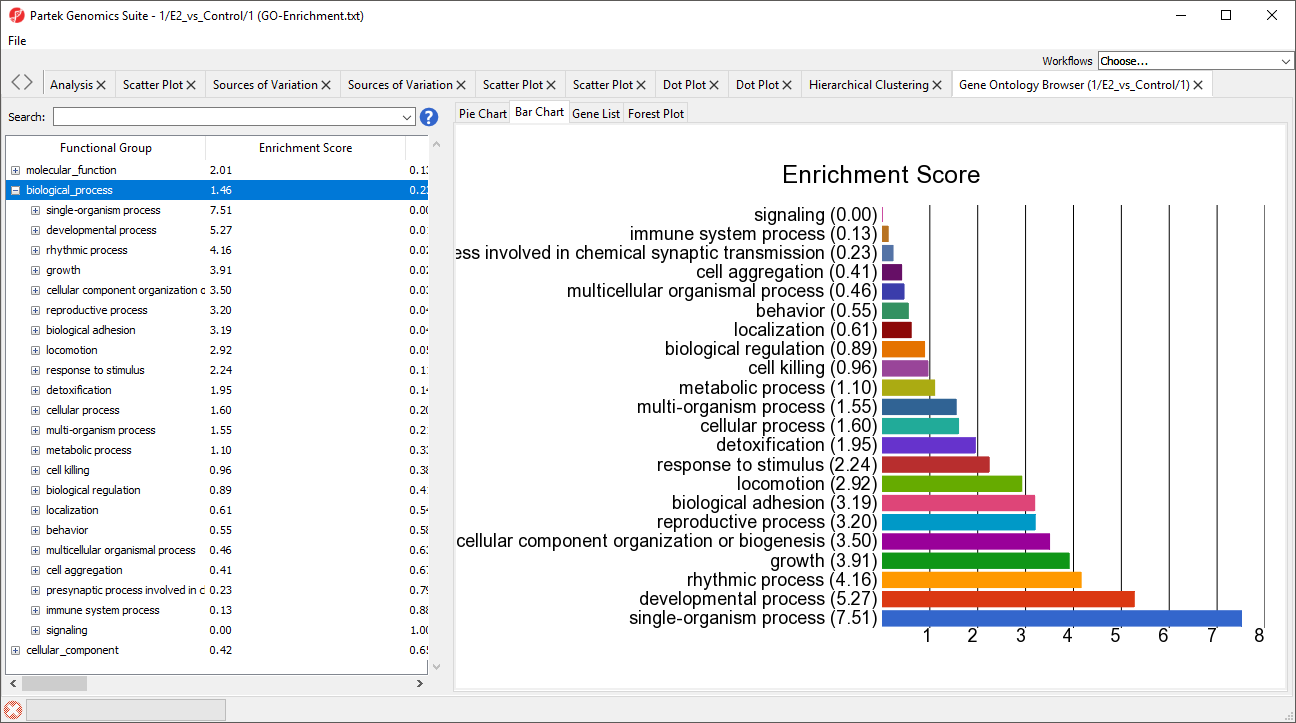
The bar chart shows the GO terms with the highest enrichment scores for the gene list.
To learn more about GO enrichment and using the Gene Ontology Browser, please consult the Gene Ontology Enrichment tutorial.
| Additional assistance |
|---|
|
| Rate Macro | ||
|---|---|---|
|
Overview
Content Tools