Page History
...
- Select (
 ) from the plot command bar
 - Select Axes
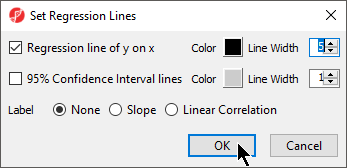
- Select Set Regression Lines
- Select Regression line of y on x
- Set Line Width to 5
- Select OK (Figure 2)
| Numbered figure captions | ||||
|---|---|---|---|---|
| ||||
|
...
Overview
Content Tools
...
) from the plot command bar
| Numbered figure captions | ||||
|---|---|---|---|---|
| ||||
|
...