Page History
...
We will invoke a volcano plot from an ANOVA results child spreadsheet with genes on rows.
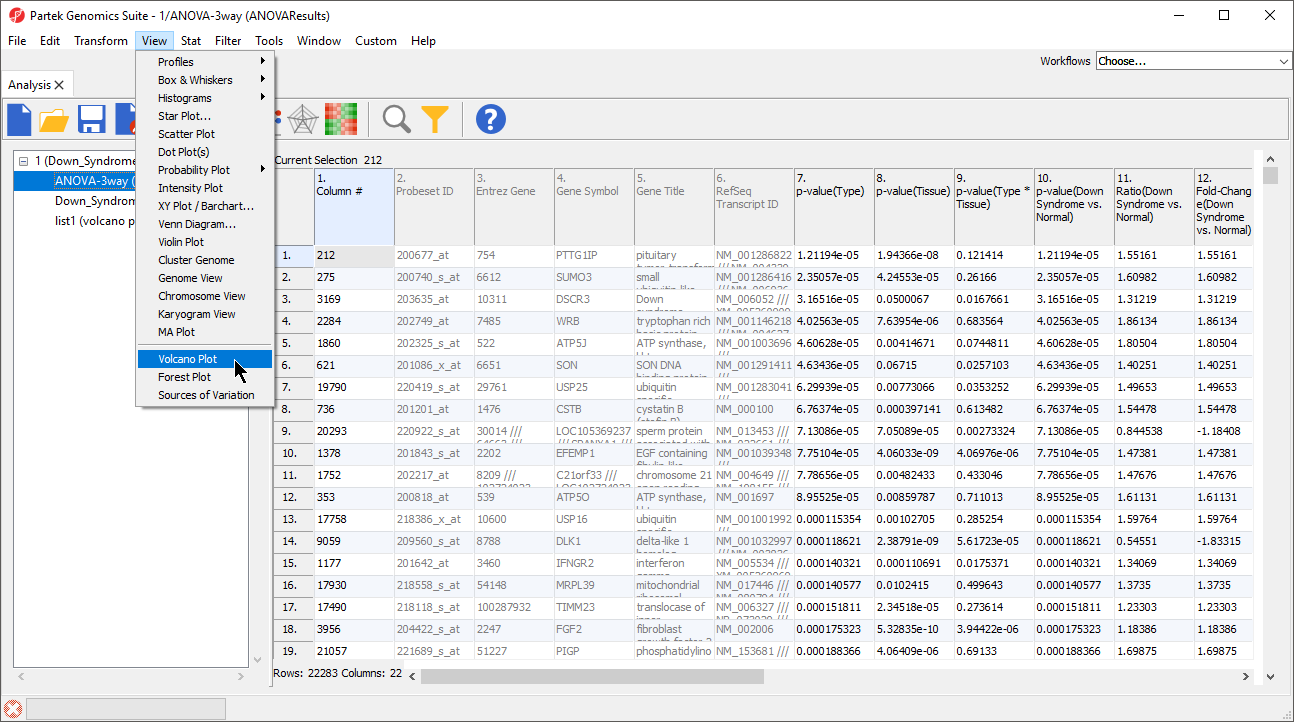
- Select View from the main toolbar
- Select Volcano Plot (Figure 1)
| Numbered figure captions | ||||
|---|---|---|---|---|
| ||||
|
The Volcano Plot Configure dialog will open (Figure 2).
| Numbered figure captions | ||||
|---|---|---|---|---|
| ||||
|
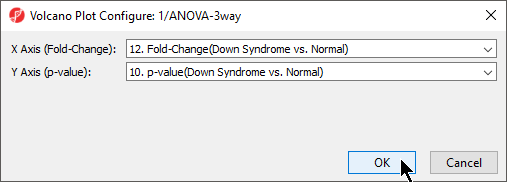
- Select the fold-change and p-value columns you would like to visualize from the ANOVA results spreadsheet; here we have chosen 12. Fold-Change(Down Syndrome vs. Normal) for the X Axis and 10. p-value(Down Syndrome vs. Normal) for Y Axis
- Select OK
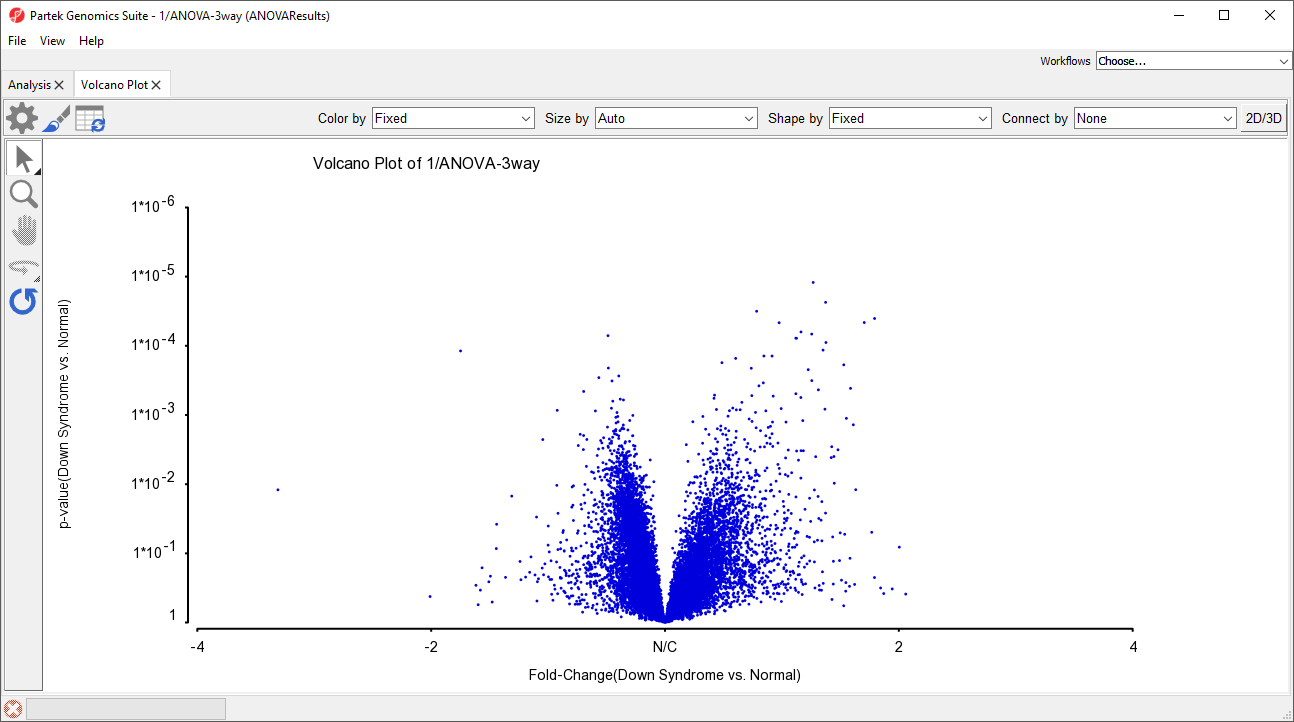
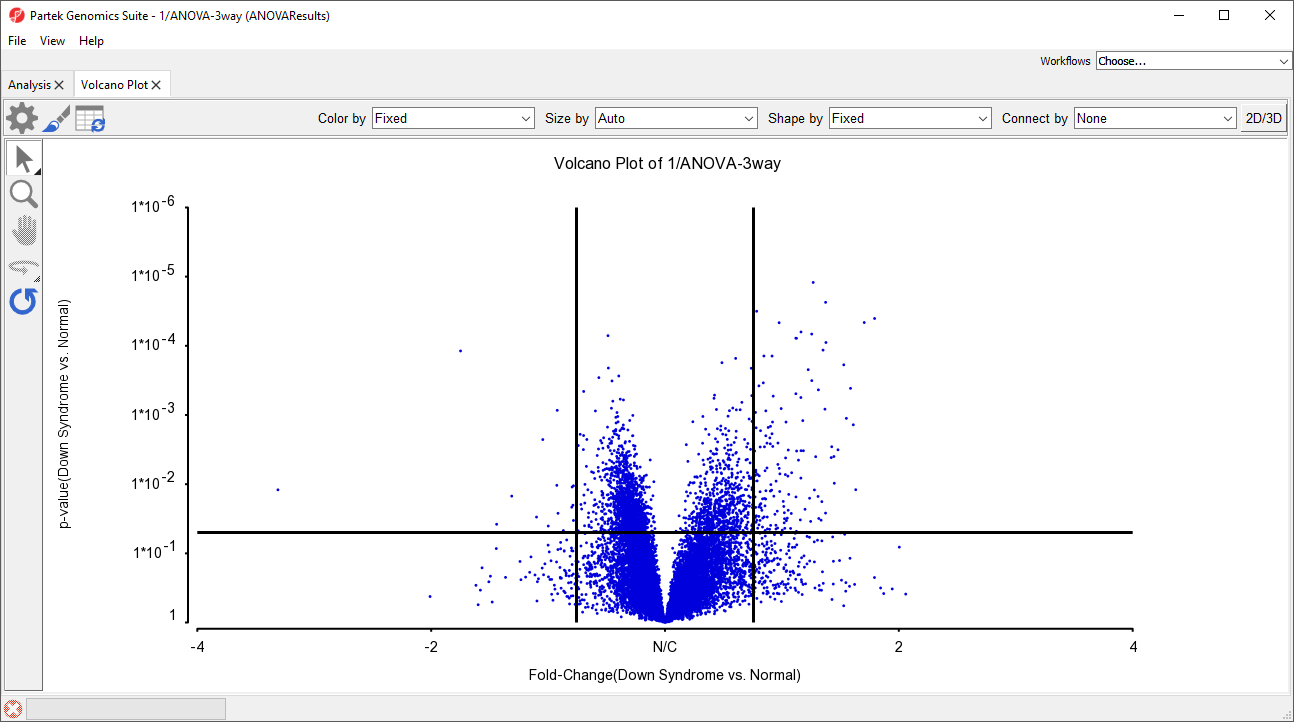
The volcano plot will open in a new tab (Figure 3). Control and color options for the volcano plot are largely similar to those described for Dot Plot. On volcano plots with many probe(sets)/genes, the shapes and sizes of individual probe(sets)/genes will not be visible until they are selected.
| Numbered figure captions | ||||
|---|---|---|---|---|
| ||||
|
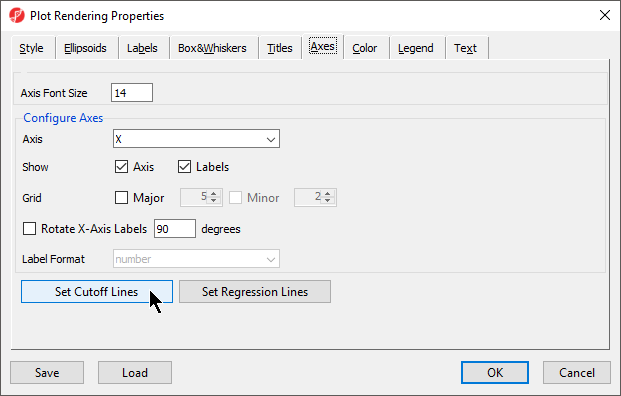
- Select (
 )
) - Select Axes
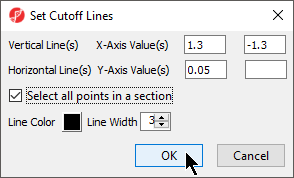
- Select Set Cutoff Lines (Figure 4)
| Numbered figure captions | ||||
|---|---|---|---|---|
| ||||
|
- Set Vertical Line(s) to 1.3 and -1.3
- Set Horizontal Line(s) to 0.05
- Select Select all points in a section
- Select OK (Figure 5)
| Numbered figure captions | ||||
|---|---|---|---|---|
| ||||
|
- Select OK to close the Plot Rendering Properties dialog
The volcano plot now has cutoff lines for fold-change and p-value (Figure 6).
| Numbered figure captions | ||||
|---|---|---|---|---|
| ||||
|
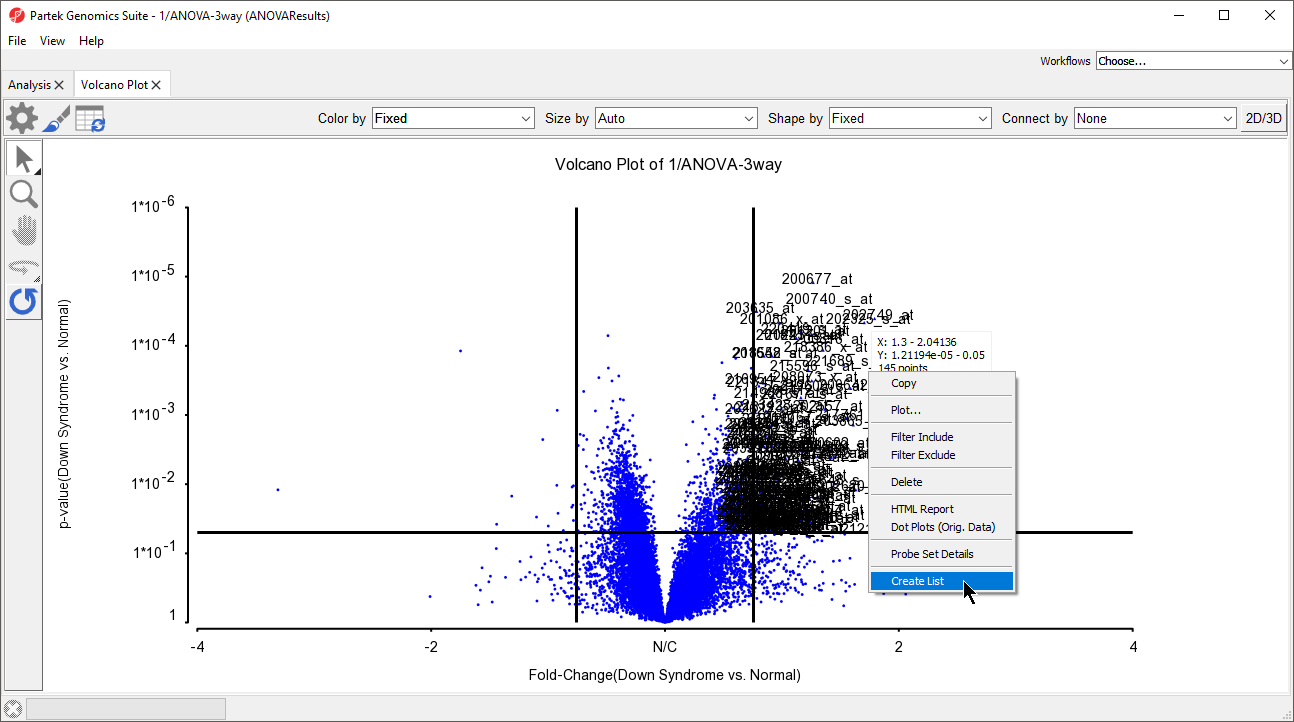
Because we selected Select all points in a section when adding the cutoff lines, selecting any of the quandrants will select all probe(sets)/genes in that quadrant. If this option is not selected, individual probe(sets)/genes or groups can be selected using selection mode. Gene lists can be generated from selected probe(sets)/genes.
- Select the upper right-hand quadrant of the volcano plot
- Right click the selected quadrant
- Select Create List (Figure 7)
| Numbered figure captions | ||||
|---|---|---|---|---|
| ||||
|
- Give the new list a name and description as appropriate
- Select OK
The list will be saved as a text file and opened as a child spreadsheet in the Analysis tab. Note that if columns are selected in the ANOVA results source spreadsheet for the volcano plot, only those columns will be included in the created list.
| Page Turner | ||
|---|---|---|
|
| Additional assistance |
|---|
|
| Rate Macro | ||
|---|---|---|
|
...
Overview
Content Tools