Page History
...
| Numbered figure captions | ||||
|---|---|---|---|---|
| ||||
|

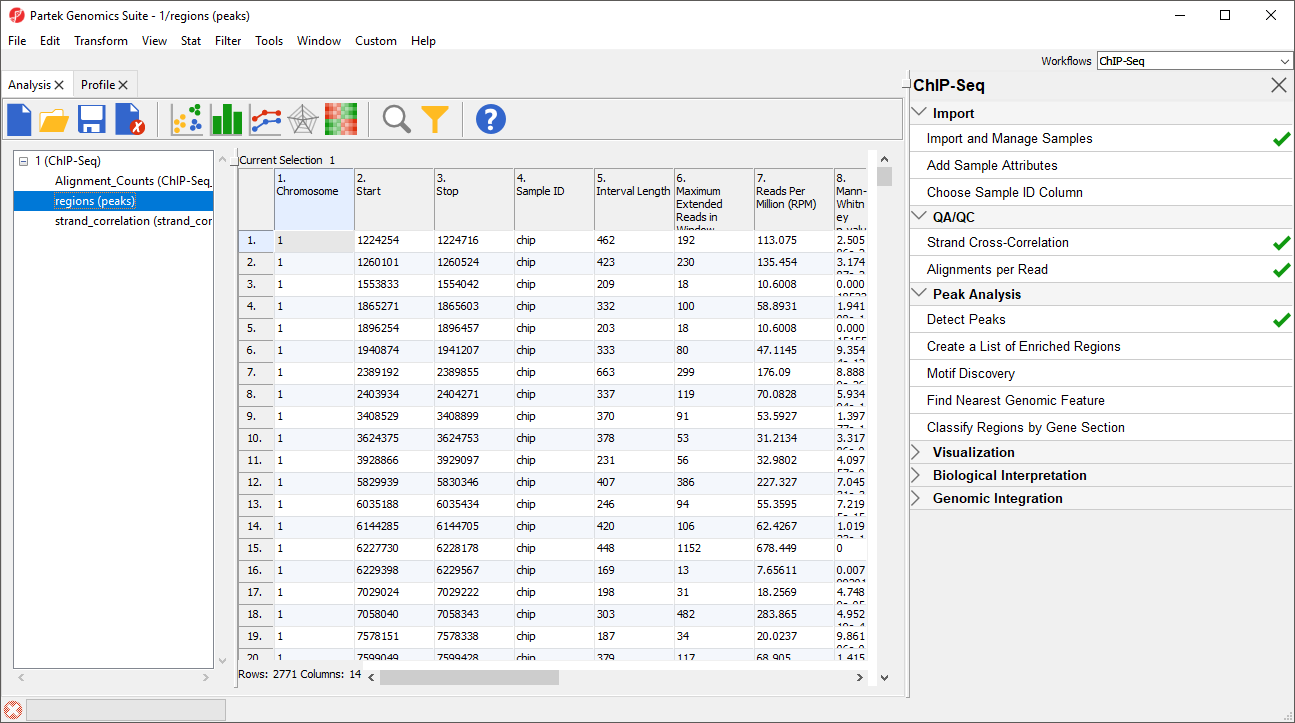
This spreadsheet is sorted by chromosome number and genomic location. Each row represents one genomic region of peak enrichment. The columns are:
...
Overview
Content Tools
...
| Numbered figure captions | ||||
|---|---|---|---|---|
| ||||
|
This spreadsheet is sorted by chromosome number and genomic location. Each row represents one genomic region of peak enrichment. The columns are:
...