Page History
...
| Numbered figure captions | ||||
|---|---|---|---|---|
| ||||
|
| Numbered figure captions | ||||
|---|---|---|---|---|
| ||||
|
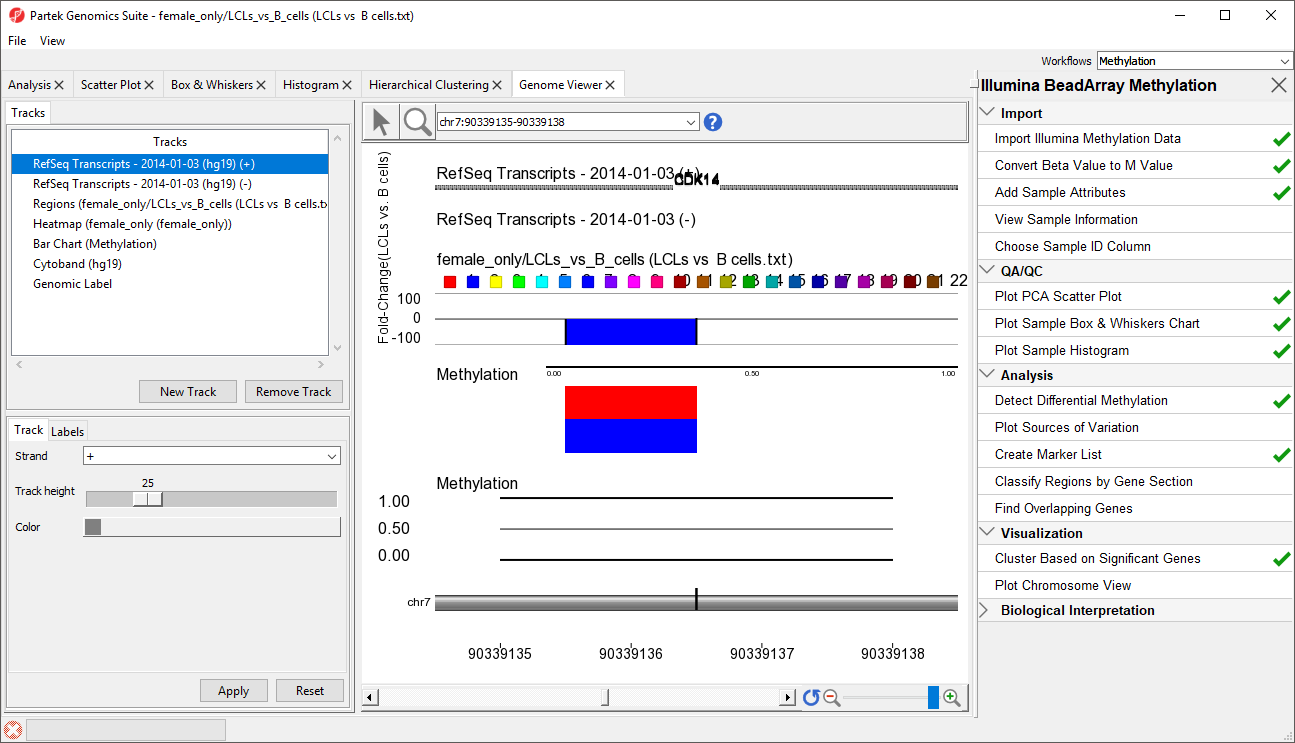
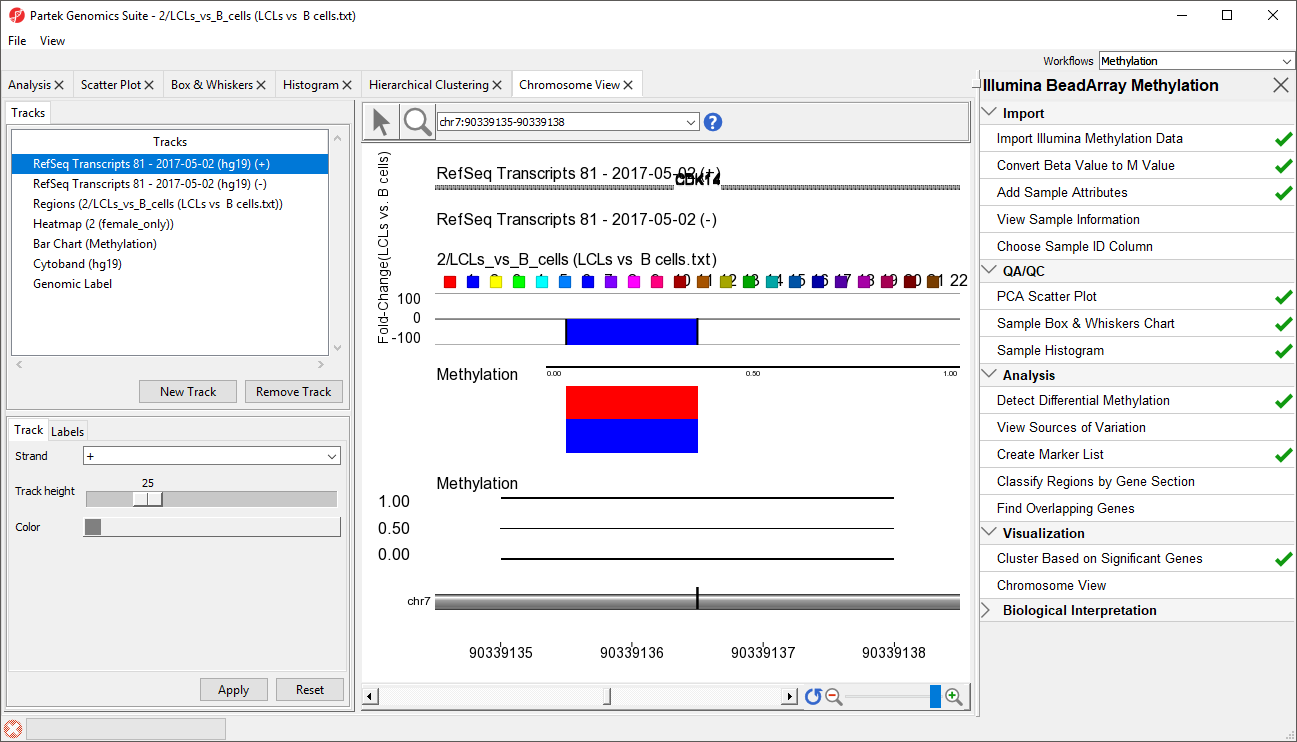
- RefSeq Transcripts 20142017-0105-03 02 (hg19) (+): transcripts coded by the positive strand
- RefSeq Transcripts 20142017-0105-03 02 (hg19) (-): transcripts coded by the negative strand
- Regions: by default, fold-change difference in methylation between the groups
- Heatmap: M values for all the samples
- Barchart: methylation levels of the selected sample (to select a sample, click on a heat map)
- Cytoband: cytobands of the current chromosome
- Genomic Label: coordinates on the current chromosome
...
Overview
Content Tools