...
| Numbered figure captions |
|---|
| SubtitleText | Hierarchical clustering with heat map invoked on a list of significant CpG loci |
|---|
| AnchorName | heat map |
|---|
|
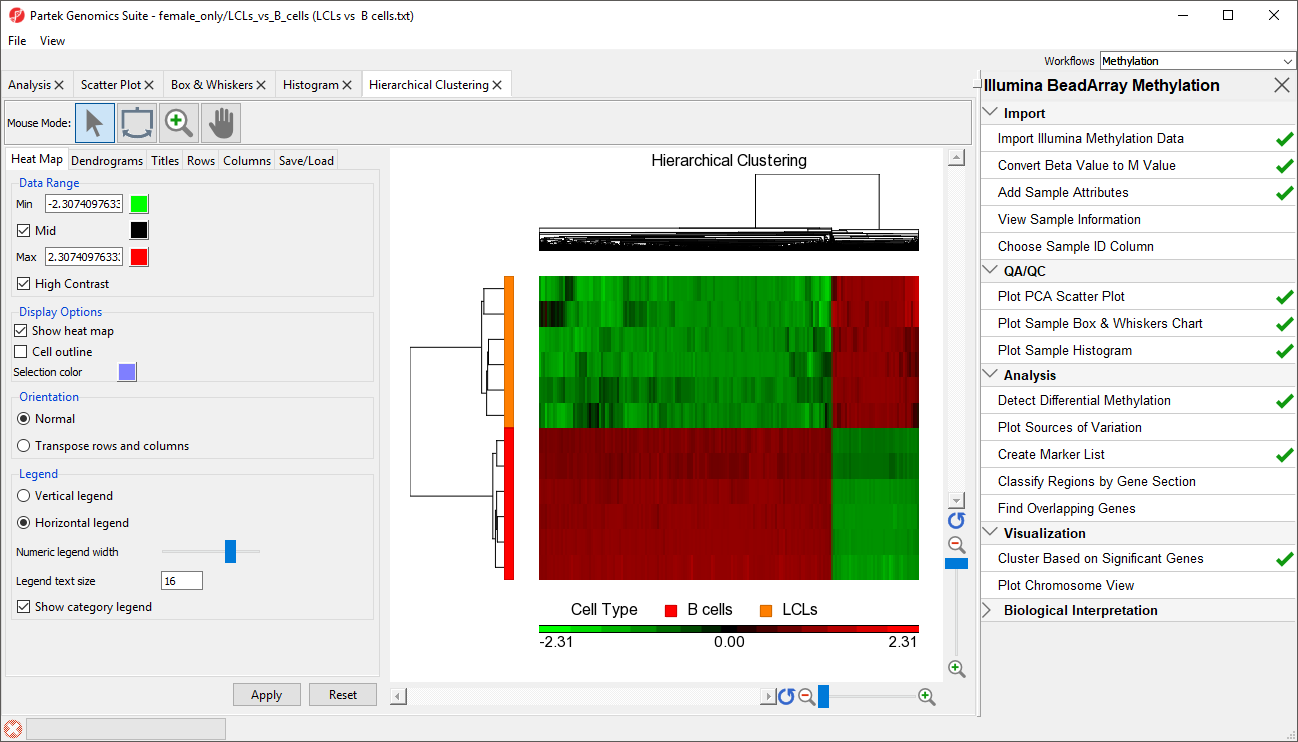 Image Removed Image Removed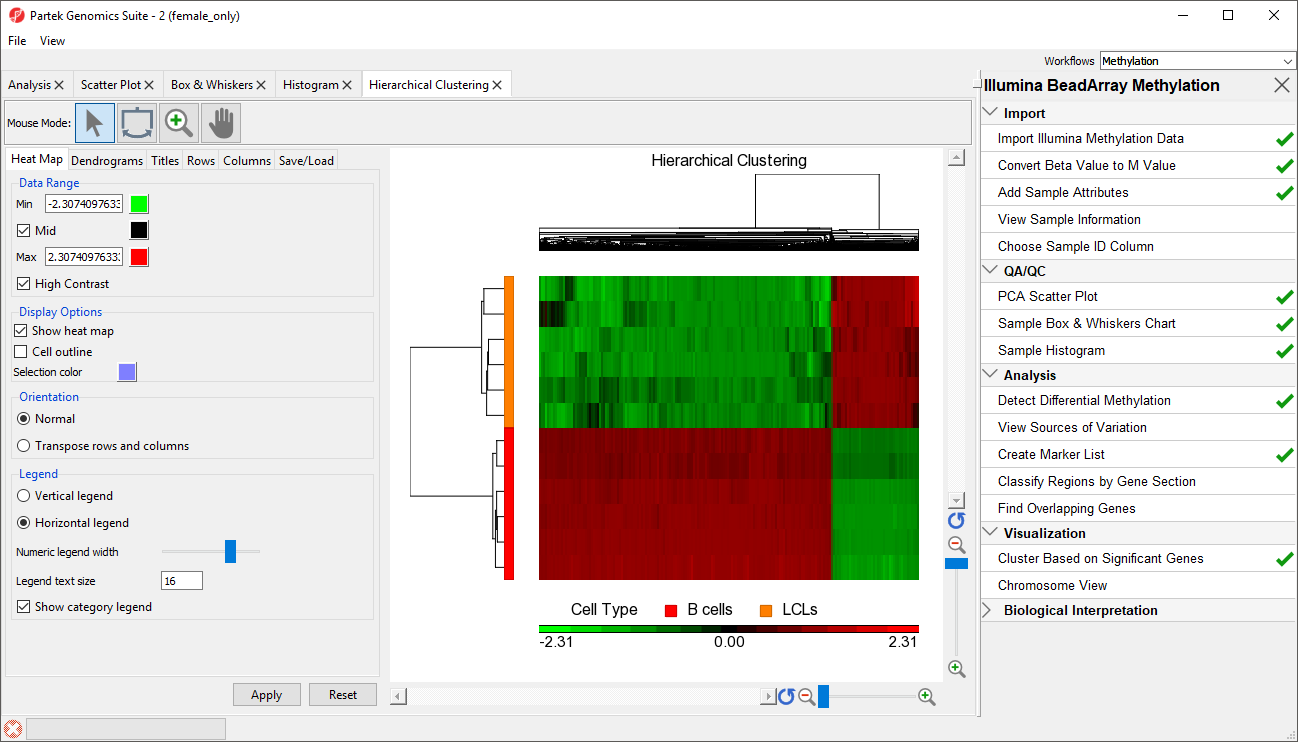 Image Added Image Added
|
The experimental groups are rows, while the CpG loci from the
LCLs vs B cells spreadsheet are columns. Methylation levels are compared between the LCLs and B cells groups. CpG loci with higher methylation are colored red, CpG loci with lower methylation are colored green. LCLs samples are colored orange and B cells samples are colored red in the dendrogram on the the left-hand side of the heat map.
...