Page History
...
| Numbered figure captions | ||||
|---|---|---|---|---|
| ||||
|

The two track display the detected regions at each location on the chromosome for the NRSF-enriched sample, chip, and aligned them to the de novo discovered motif binding sites. If you have not gone through the steps for peak detection and motif discovery, these tracks will not be available.
...
| Numbered figure captions | ||||
|---|---|---|---|---|
| ||||
|
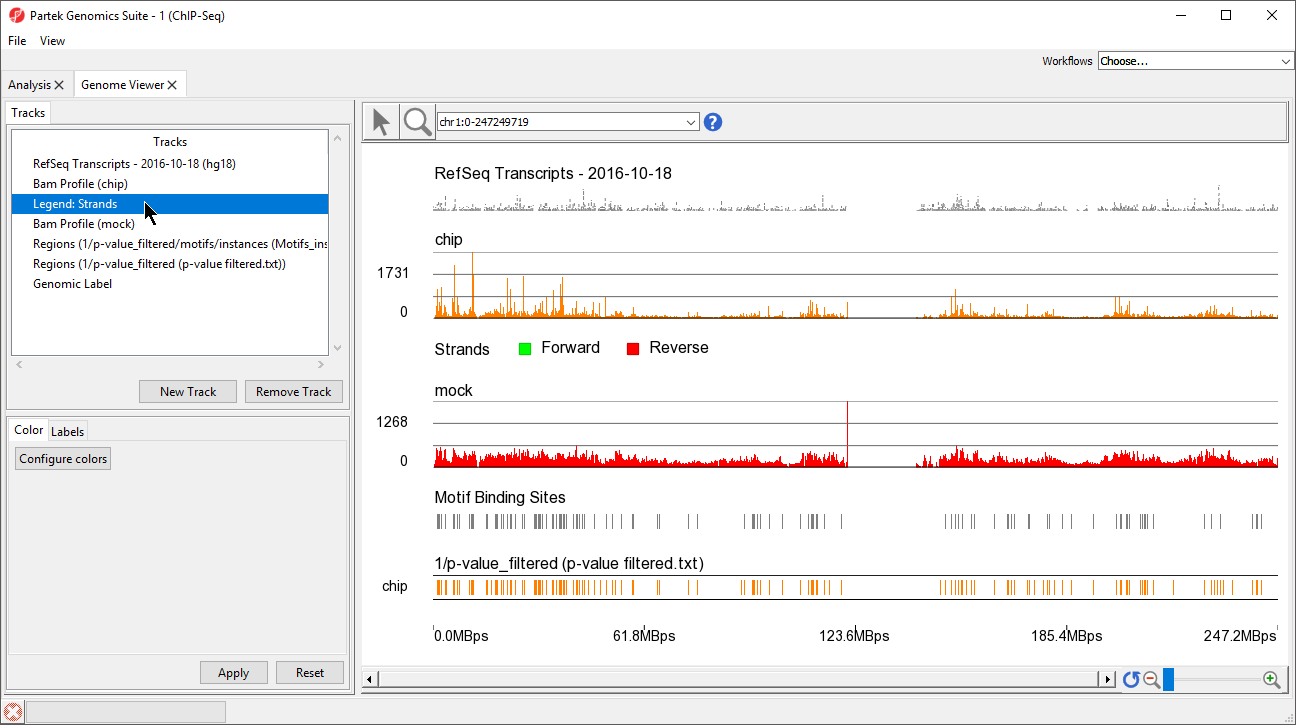
The Genome Viewer opens to a whole-chromosome view of chromosome 1. To analyze the data we can zoom in on the data (Figure 6).
...
| Numbered figure captions | ||||
|---|---|---|---|---|
| ||||
|

There are four methods for zooming in and out in the Genome Viewer. (1) Select (![]() ) to activate Zoom/Navigate Mode. With this mode selected, left-clicking and drawing a box on a track will zoom to the region in the box. (2) Use the mouse scroll wheel (3) Select the zoom in (
) to activate Zoom/Navigate Mode. With this mode selected, left-clicking and drawing a box on a track will zoom to the region in the box. (2) Use the mouse scroll wheel (3) Select the zoom in (![]() ) and zoom out (
) and zoom out (![]() ) on the zoom controls (
) on the zoom controls ( ). Selecting (
![]() ) resets the zoom to whole chromosome. (4) Use the slider on the zoom controls (). (5) Zoom to a location or gene by typing the coordinates or gene name in the Navigation bar (
) resets the zoom to whole chromosome. (4) Use the slider on the zoom controls (). (5) Zoom to a location or gene by typing the coordinates or gene name in the Navigation bar ( ) and pressing Enter on your keyboard. (5) Starting on a spreadsheet, right-click a row with region information, and select Browse to Location.
...
Overview
Content Tools