Page History
...
We can check the quality of the samples using Partek Genomics Suite before analyzing the data.
Strand cross-correlation
Text goes here.
In ChIP-Seq, genomic DNA is fragmented by restriction digest and target-protein-bound DNA fragments are purified by immunoprecipitation. These fragments are between 100 and 500 base pairs depending on the protocol; however, because ChIP-Seq uses short-read sequencing (25 to 35 base pair reads) to maximize sequencing depth, only the ends of each fragment will be sequenced. Consequently, in single-end sequencing reads on the forward and reverse strands for the same fragment will be from opposite ends of each fragment. At a protein-binding site, there will thus be two peaks, one from enrichment of forward strand reads and another from enrichment of reverse strand reads. The average distance between these peaks is termed the effective fragment length. Because the forward and reverse strand peaks are generated from a common set of fragments, the peaks should be roughly symmetrical. Strand Cross-Correlation allows us to find the effective fragment length by calculating the Pearson correlation coefficient between the read densities of the forward and reverse strands after different effective fragment length phase shifts are applied (Kharchenko et al., 2008). This is visualized with a range of possible effective fragment length phase shifts on the x-axis and the Pearson correlation coefficient between forward and reverse strand read densities when each phase shift is applied (Figure 1). High-quality ChIP-Seq data will give a strong peak on the Strand Cross-Correlation plot for the effective fragment length. For paired-end sequencing, Strand Cross-Correlation is calculated from the distribution of distances between the paired reads from the ends of each fragment. When calling peaks, the forward and reverse (or paired end) reads are each phase-shifted by the effective fragment length to create a combined read density profile.
Let's perform Strand Cross-Correlation.
- Select Strand Cross-Correlation from the QA/QC section of the ChIP-Seq workflow
If you have not run this step before, you will be asked if you would like to create a new QA/QC child spreadsheet.
- If prompted, select Yes to create a new child spreadsheet for QA/QC
After running Strand Cross-Correlation, the Strand Separation of Samples viewer will open as a new tab (Figure 1).
| Numbered figure captions | ||||
|---|---|---|---|---|
| ||||
|
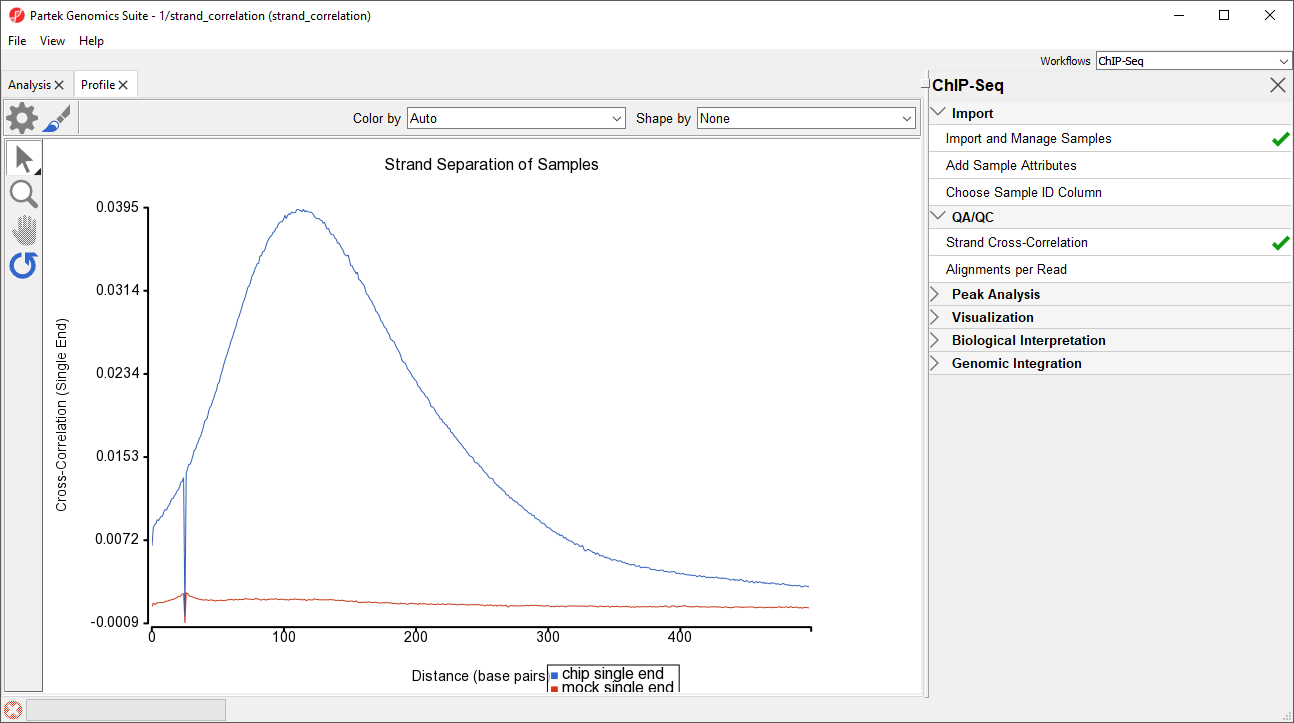
For the chip sample, we can see the peak at 111 base pairs, corresponding to an effective fragment length of 111 base pairs. This precise number can be determined by examining the values in the strand_correlation spreadsheet, by moving the cursor over the peak in the graph, or by sorting the data in the spreadsheet. In lower quality ChIP-Seq data, we might also see a peak at the read length. The ratio between the Pearson correlation coefficient of the effective fragment length peak and the read length peak, normalized with the minimum correlation coefficient, cc(fragment length) - min(cc) ]/ cc(read length) - min(cc) should be greater than 0.8 according to the guidelines outlined by the ENCODE project (Landt et al., Genome Research, 2012).
Checking the distribution of reads
...
Overview
Content Tools