Page History
...
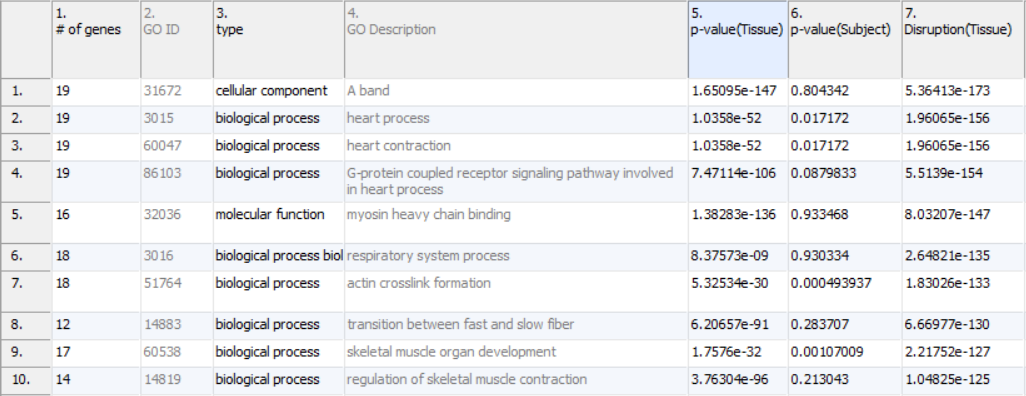
Filtering for low p-values on the factor and then filtering for low p-values on the factor interacted with gene will find groups that are differentially expressed, but contain at least a few genes that are either disrupted due to treatment, or simply are involved in additional functional groups beyond the scope of the one being analyzed. This list often contains some of the more informative big picture functional groups.
| Numbered figure captions | ||||
|---|---|---|---|---|
| ||||
|
...
Overview
Content Tools