Page History
...
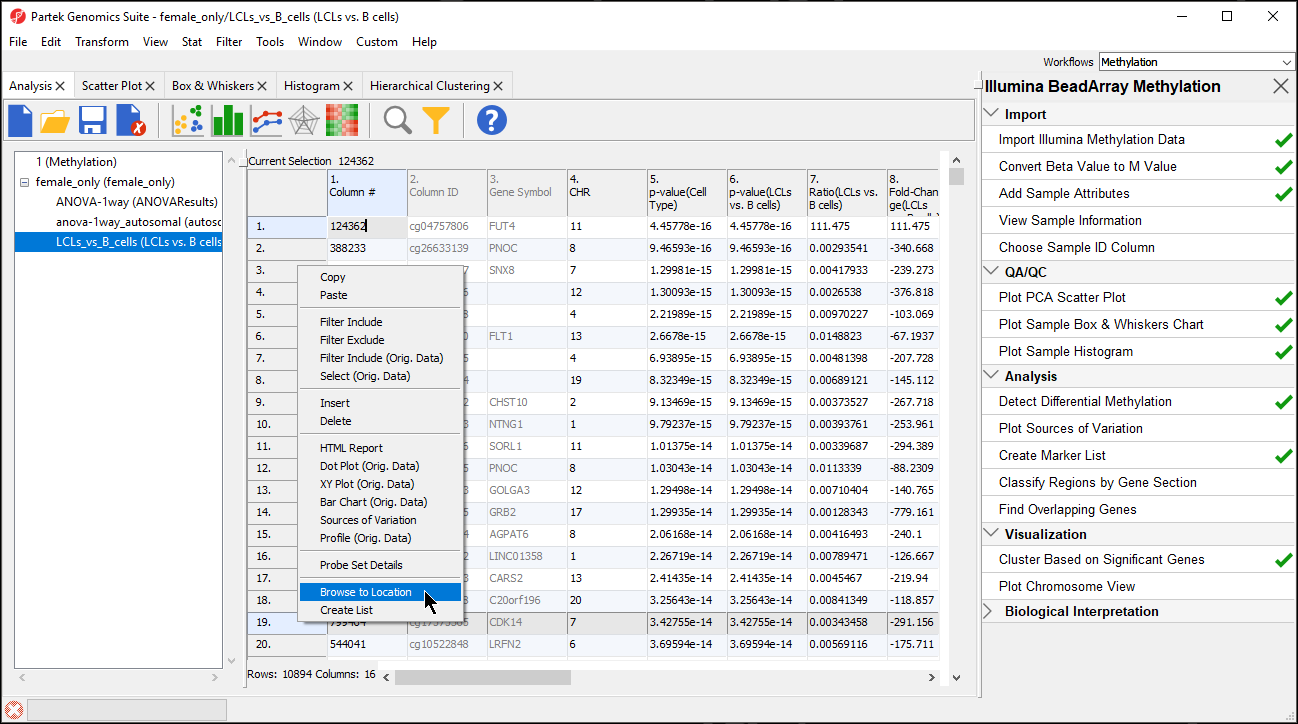
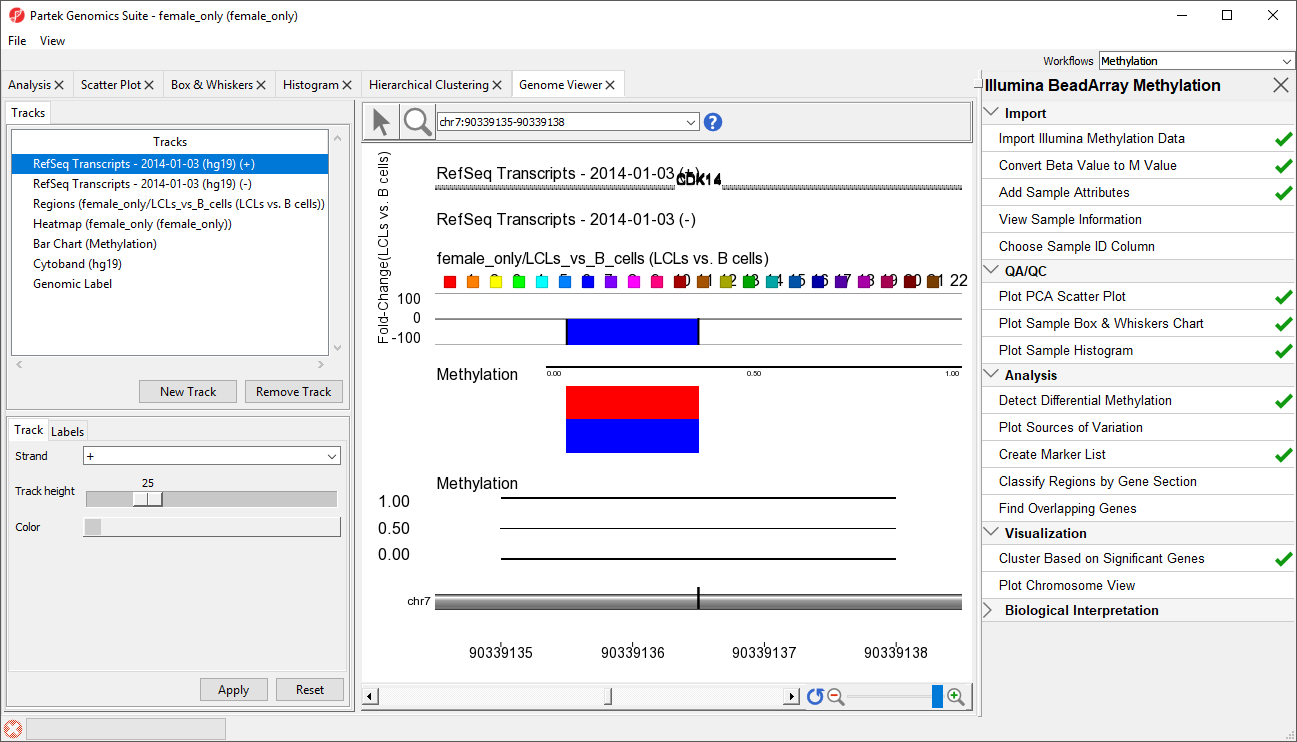
Partek Genomics Suite enables you to visualize each probe and compare the methylation between the groups at a single CpG site level.
- Right click row 19 Cdk14 in the LCLs vs. B cells spreadsheet
- Select Browse to Location from the pop-up menu
| Numbered figure captions | ||||
|---|---|---|---|---|
| ||||
|
| Numbered figure captions | ||||
|---|---|---|---|---|
| ||||
|
The visualization can be supplemented with a special annotation file which can be built using a UCSC annotation file as the basis. Building and viewing the UCSC annotation file is available as an optional section of the tutorial, Optional: Adding UCSC CpG Island Annotations.
...
Overview
Content Tools