Page History
...
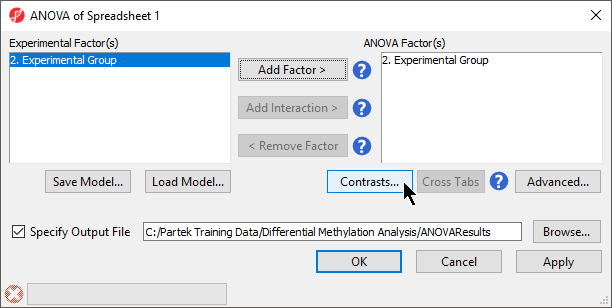
- Select Defect Differential Methylation from the Analysis section of the Illumina BeadArray Methylation workflow
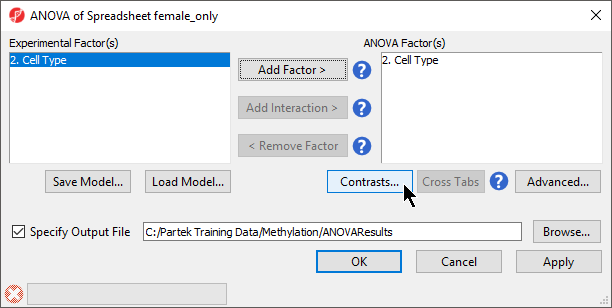
- Select 32. shRNA treatment Cell Type from the Experimental Factor(s) panel
- Select Add Factor > to move 32. shRNA treatment Cell Type to the ANOVA Factor(s) panel (Figure 1)
| Numbered figure captions | ||||
|---|---|---|---|---|
| ||||
|
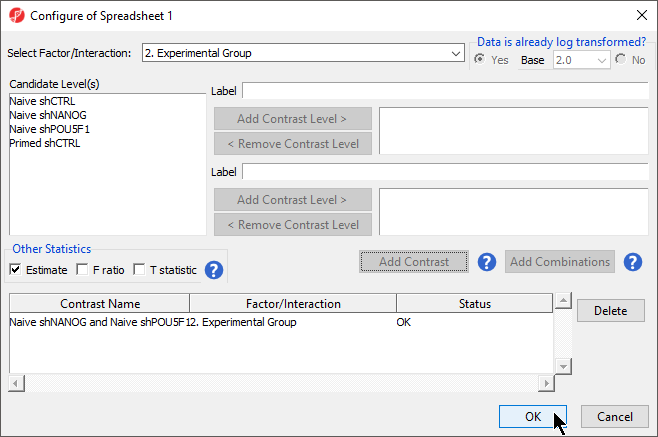
- Select Contrasts...
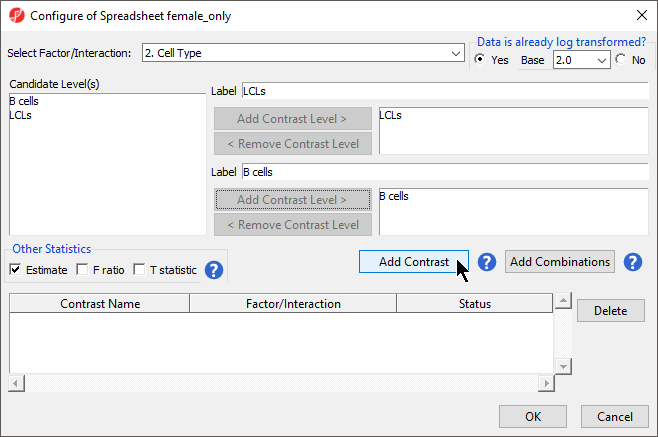
- Select Yes for Data is already log transformed? because M-values are based on logit transformation
- Select Naive shPOU5F1 LCLs
- Select Add Contrast Level > for the upper group
- Repeat to add Naive shNANOG and Primed shCTRL to the upper group
- Select Naive shCTRL
- Select Select B cells
- Select Add Contrast Level > for the lower group
- Select Add Contrast
- Select the Estimate box in the Other Statistics section of the Configure dialog (Figure 2)
- Select Add Contrast
By default, the fold-change value for each contrast will be calculated with the upper group as the numerator and the lower group as the denominator. Selecting Estimate will also include the difference in methylation levels between the groups at each CpG site in the output. These values will be needed later in the tutorial when we filter the differentially methylated loci.
| Numbered figure captions | ||||
|---|---|---|---|---|
| ||||
|
- Select Add CombinationSelect OK to close the Configuration dialog
...
| Numbered figure captions | ||||
|---|---|---|---|---|
| ||||
|
| Numbered figure captions | ||||
|---|---|---|---|---|
| ||||
|
| Page Turner | ||
|---|---|---|
|
...
Overview
Content Tools