Page History
...
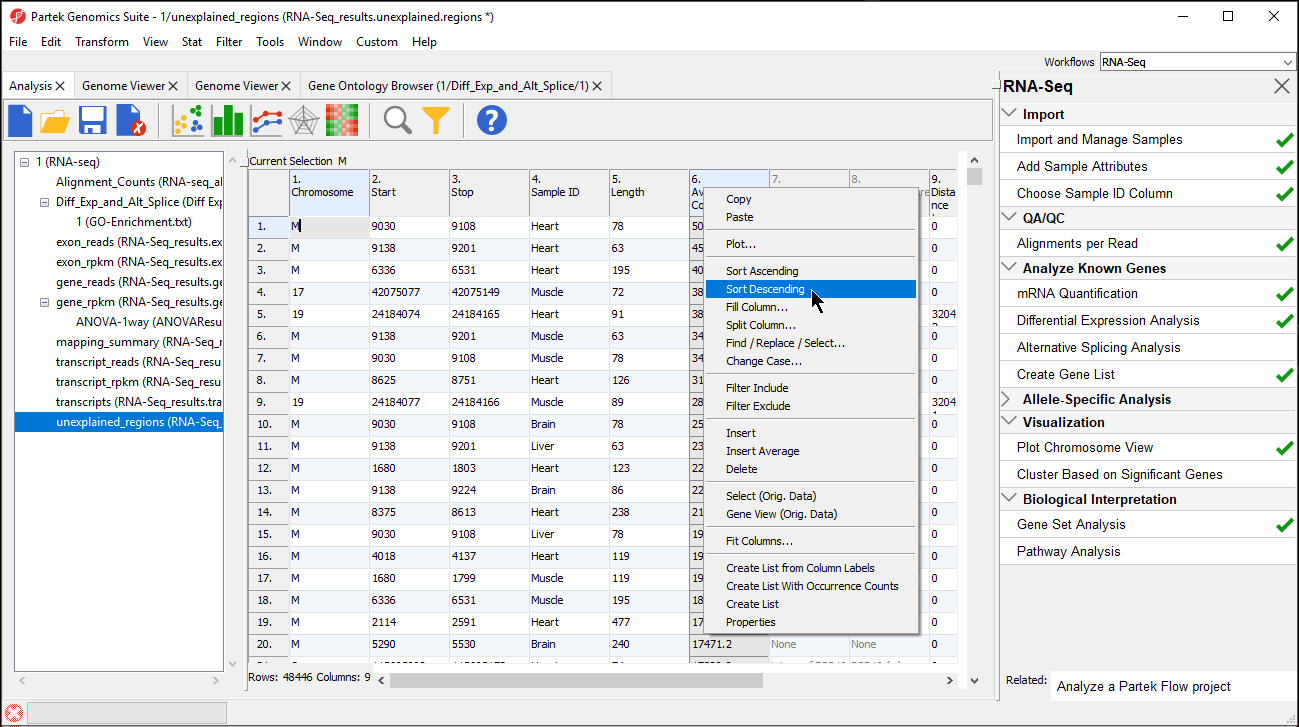
The closest overlapping feature and the distance to it is now included as columns 7. Overlapping Features and 8. Nearest Features in the unexplained_regions spreadsheet (Figure 4).
Right-clicking on a row header and selecting Browse to Location will show the reads mapped to the chromosome. For this tutorial, a couple of genes are selected to show regions that are located after a known gene or in the intron of a gene.
- With the unexplained_regions spreadsheet open, right-click on Average Coverage (column 6) and select Sort Descending (Figure 54)
| Numbered figure captions | ||||
|---|---|---|---|---|
| ||||
|
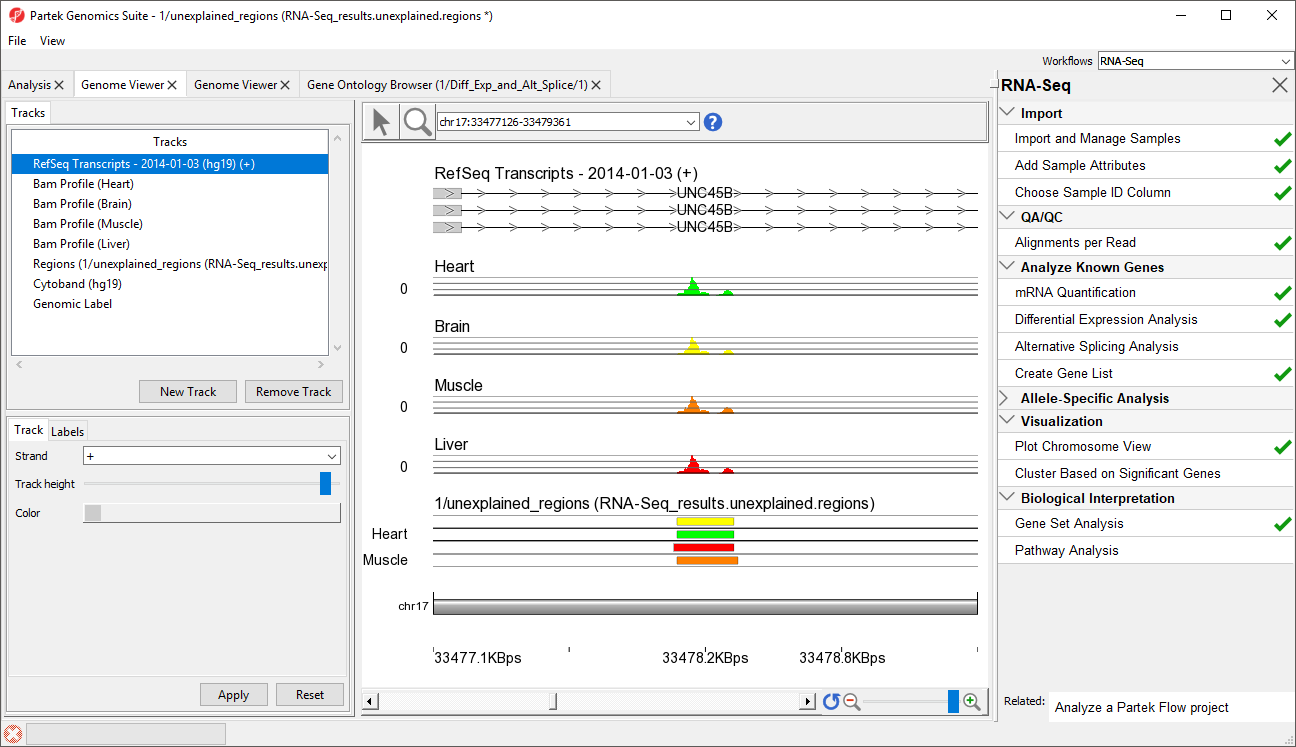
- Select row 45 and Browse to location to show a region within an intron of UNC45B. This may be a novel exon (Figure 65)
| Numbered figure captions | ||||
|---|---|---|---|---|
| ||||
|
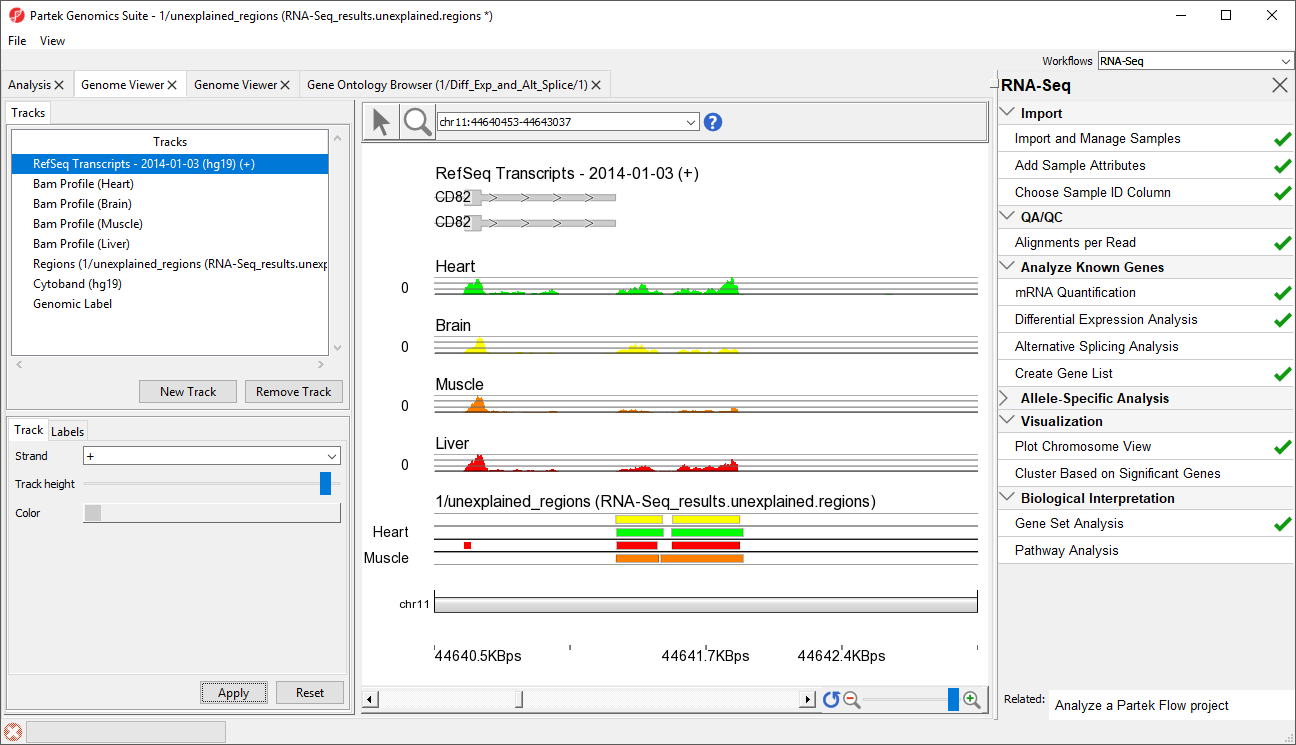
- Select row 10482 and Browse to location to show a region that starts 1 bp after CD82. This peak may represent an extended exon (Figure 76)
| Numbered figure captions | ||||
|---|---|---|---|---|
| ||||
|
...
Overview
Content Tools