Page History
...
| Numbered figure captions | ||||
|---|---|---|---|---|
| ||||
|
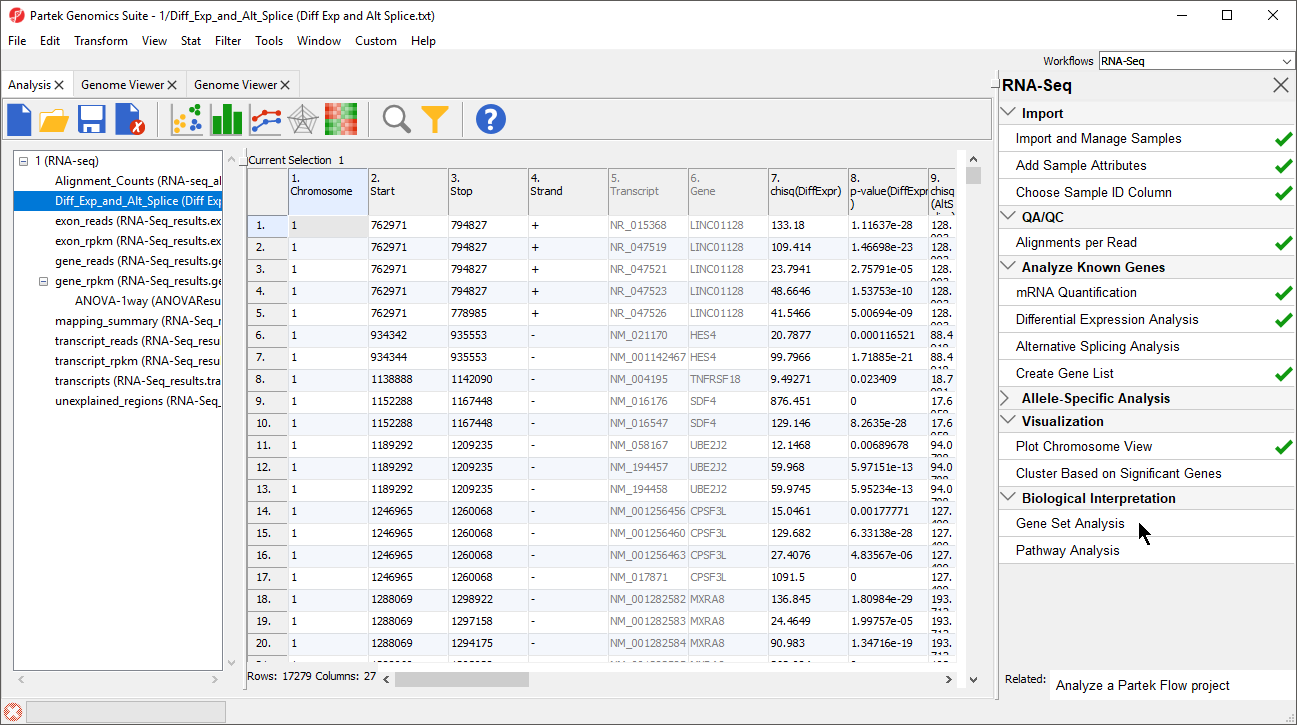
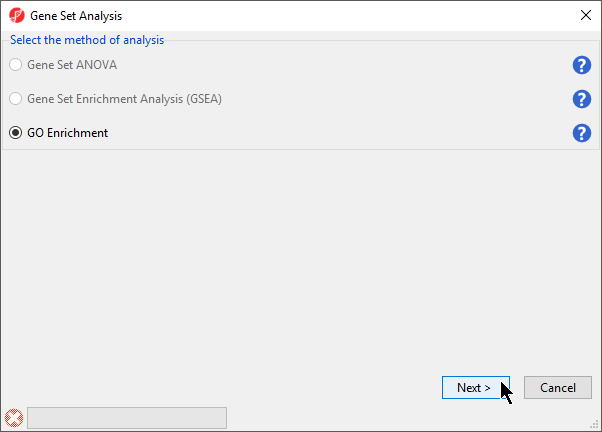
- Select GO Enrichment in the the Gene Set Analysis dialog and then select Next dialog (Figure 2)
- Select Next >
| Numbered figure captions | ||||
|---|---|---|---|---|
| ||||
|
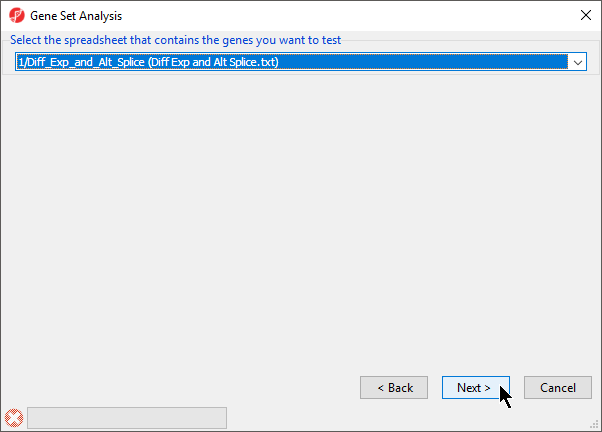
- Choose Select the spreadsheet 1/Diff_Exp_and_Alt_Splice (Diff Exp and Alt Splice.txt) and select Next
...
- from the drop-down menu (Figure 3)
- Select Next >
| Numbered figure captions | ||||
|---|---|---|---|---|
| ||||
|
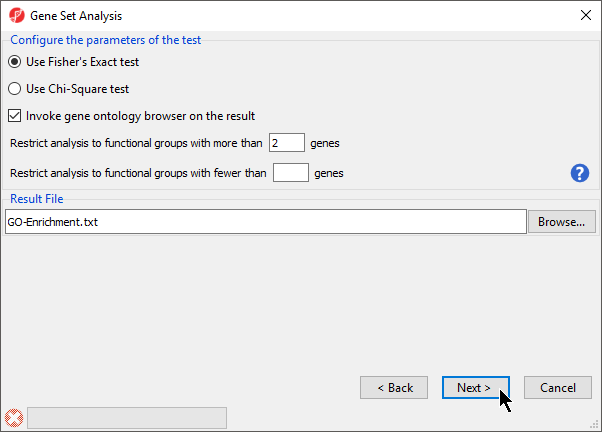
- Select Use Fisher's Exact test
- Select Invoke gene ontology browser on the result
- Set Restrict analysis to functional groups with more than _ genes to 2 (Figure 4)
- Select Next >
| Numbered figure captions | ||||
|---|---|---|---|---|
| ||||
|
- Select Default mapping file (Figure 5)
- Select Next >
| Numbered figure captions | ||||
|---|---|---|---|---|
| ||||
|
| Additional assistance |
|---|
|
| Rate Macro | ||
|---|---|---|
|
Overview
Content Tools