Page History
...
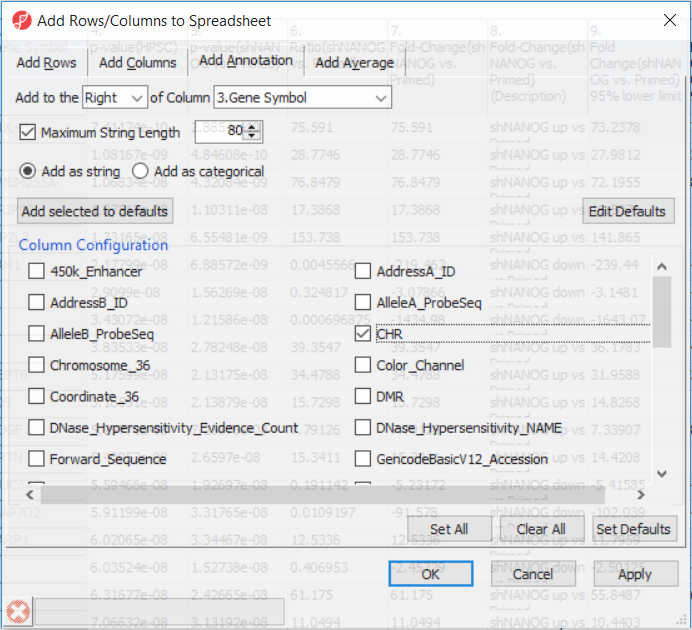
Going forward, analysis of differentially methylated loci typically includes removal of the probes on X and Y chromosomes (to avoid the problems with inactivation of one X chromosome). Another common filtering is removal of probes with known single nucleotide polymorphisms (SNP) close to the interrogation site. To annotate the ANOVA spreadsheet with the information required for filtering, right-click on the Gene Symbol column, select Insert Annotation, tick-mark the CHR and SNP_DISTANCE fileds filed (Figure 6) and push OK. Two A new columns column will be appended to the spreadsheet.
| Numbered figure captions | ||||
|---|---|---|---|---|
| ||||
|
To enable filtering right-click on the header of the CHR column > Properties and set the type to categorical (and OK). Now, activate the Interactive Filter tool (![]() ) . If needed use the drop-down list to point to the CHR column. The column chart represents the number of appearances of each chromosome in the spreadsheet (i.e. the number of probes per chromosome). To remove the probes on the X and the Y chromosome left click on the two right-most columns (the pop up baloon will show you the chromosome label) and the columns will be grayed out (Figure 7).
) . If needed use the drop-down list to point to the CHR column. The column chart represents the number of appearances of each chromosome in the spreadsheet (i.e. the number of probes per chromosome). To remove the probes on the X and the Y chromosome left click on the two right-most columns (the pop up baloon will show you the chromosome label) and the columns will be grayed out (Figure 7).
Section Heading
Section headings should use level 2 heading, while the content of the section should use paragraph (which is the default). You can choose the style in the first dropdown in toolbar.
...
Overview
Content Tools