Page History
...
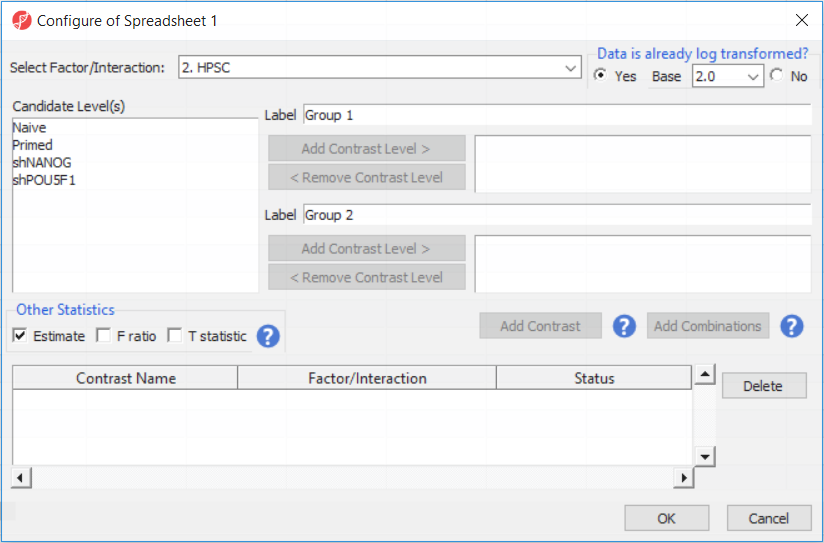
Depending on the data in the top level (i.e. parent) spreadsheet you may want need to manually specify whether the data is already log transformed: you should select Yes for M-values (but otherwise No for β-values) (, as they are based on logit transformation (Figure 2). By default, Partek Genomics Suite will calculate fold-change value for each contrast (since M-values are in log2 space, the resulting fold-change is actually a difference in methylation levels). On the other hand, and, in addition to that, if you want to include the difference in methylation levels between the groups at each CpG site in the output (quite common for β-values), check the Estimate box in the Other Statistics section of the dialog (Figure 2). The setup of the contrasts has implications on downstream steps, in particular on filtering the differentially methylated loci.
| Numbered figure captions | ||||
|---|---|---|---|---|
| ||||
|
...
| Numbered figure captions | ||||
|---|---|---|---|---|
| ||||
|
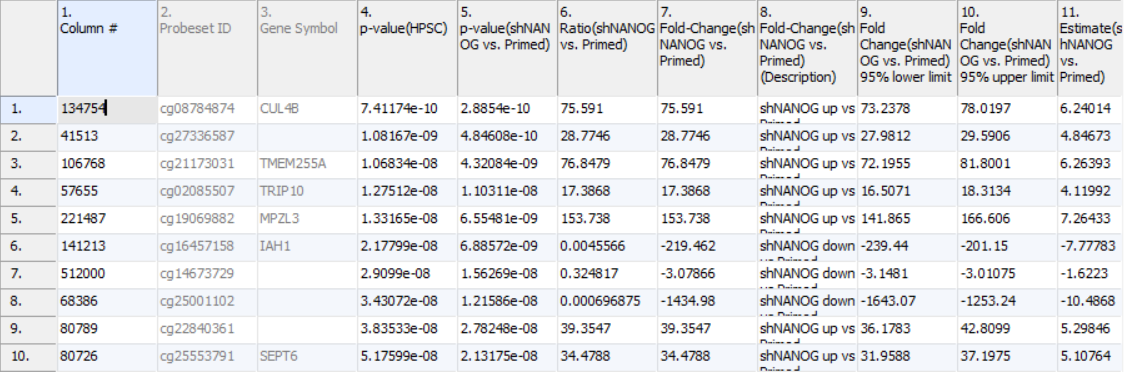
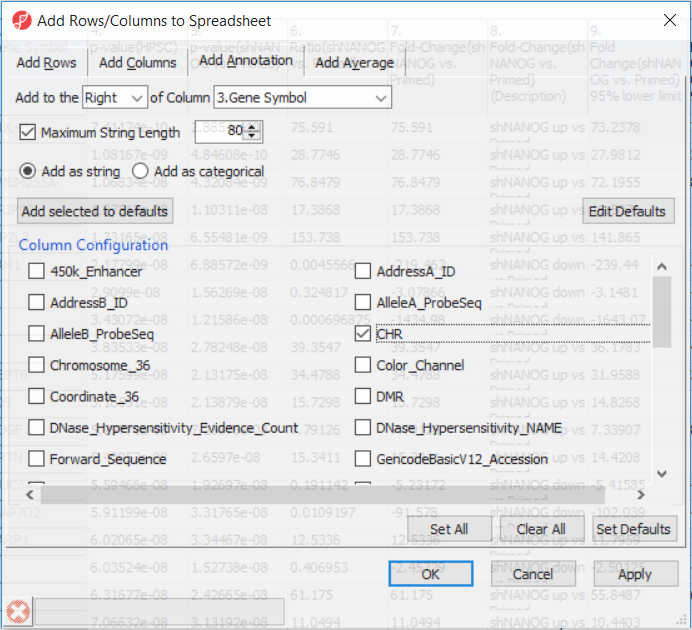
Going forward, analysis of differentially methylated loci typically includes removal of the probes on X and Y chromosomes (to avoid the problems with inactivation of one X chromosome). Another common filtering is removal of probes with known single nucleotide polymorphisms (SNP) close to the interrogation site. To annotate the ANOVA spreadsheet with the information required for filtering, right-click on the Gene Symbol column, select Insert Annotation, tick-mark the CHR and SNP_DISTANCE fileds (Figure 6) and push OK. Two new columns will be appended to the spreadsheet.
| Numbered figure captions | ||||
|---|---|---|---|---|
| ||||
|
Section Heading
Section headings should use level 2 heading, while the content of the section should use paragraph (which is the default). You can choose the style in the first dropdown in toolbar.
...
Overview
Content Tools