Page History
...
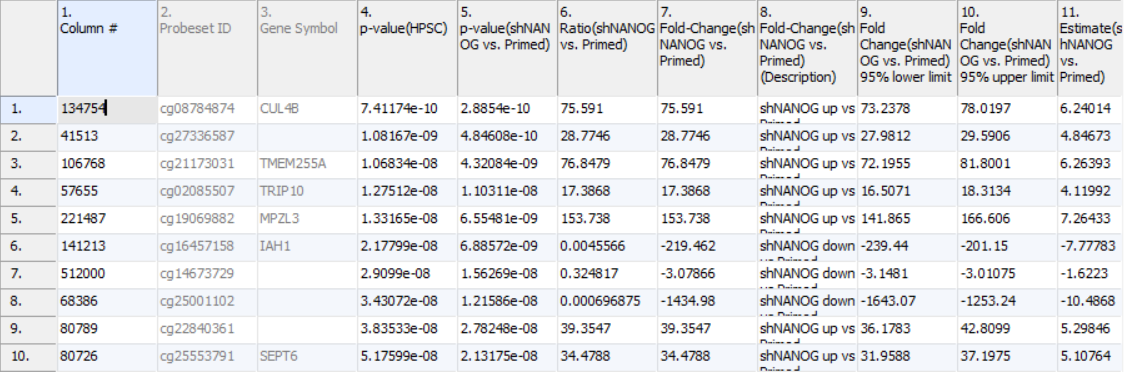
The result of 1-way ANOVA is shown in Figure 5. Each row of the table represents a single CpG locus (identified by Probeset ID column). The remaining columns contain the following information:
Column 3. Gene Symbol: the gene overlapping the probe as specified in the Illumina manifest file
Column 4. p-value(HPSC): overall p-value for the specified factor (in parenthesis). A low p-value indicates that there is a difference in methylation between the levels of this attribute (i.e. study groups). The contrast p-values should then be used to evaluate individual group comparisons. If more than one factor is included in the model, p-value will be reported for each.
Next, for each contrast included in the model, a block of seven columns will be added, as follows:
Column 5. p-value(shNANOG vs. Primed): p-value for the given contrast (in parenthesis). A low p-value indicates a difference in methylation between the groups included in the contrast (here: shNANOG and Primed).
Column 6. Ratio(shNANOG vs. Primed): ratio of average methylation level in one over the other the other contrasted group (shNANOG and Primed, respectively). Ratio is reported in linear space.
Column 7. Fold Change(shNANOG vs. Primed): fold-change in one over the other contrasted group (shNANOG and Primed, respectively). Fold-change is reported in linear space.
Column 8. Fold Change(shNANOG vs. Primed) (Description): if fold-change > 1, it means hypermethylation in the first group (e.g. shNANOG up vs Primed), if fold-change < -1, it means hypomethylation in the first group (e.g. shNANOG down vs Primed), relative to the second group (Primed). This column enables quick filtering
Columns 9. & 10. Lower and upper (respectively) limits of 95% confidence interval of the fold-change
Column 11. Estimate(shNANOG vs. Primed): difference between means of two groups (i.e. shNANOG and Primed) (this column is optional and depends on the way contrasts were set up)
Columns 12. - 18. correspond to columns 5. - 11.
Columns 19.+ Statistical output
| Numbered figure captions | ||||
|---|---|---|---|---|
| ||||
|
...
Overview
Content Tools