Page History
...
| Numbered figure captions | ||||
|---|---|---|---|---|
| ||||
|
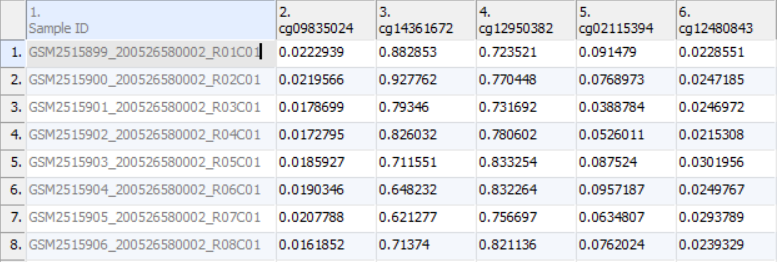
As discussed in the previous chapter, the values in the cells are normalized β-values, which correspond to the percentage of methylation at each site and are calculated as the ratio of methylated probe intensity over the overall intensity at each site (the overall intensity is the sum of methylated and unmethylated probe intensities). An alternative metric for measurement of methlyation levels are M-values. β-values can be easily converted to M-values using the following equation:
...
| Numbered figure captions | ||||
|---|---|---|---|---|
| ||||
|
The following dialog is Create Categorical Attribute (Figure 3). The Attribute name filed specifies the name of the new column (attribute), while the groups (levels of the attribute) are specified in the Group Name fields. By default, two groups are created, but additional ones can be added using the New Group button. Finally, drag and drop the samples from the Unassigned list to their matching groups.
| Numbered figure captions | ||||
|---|---|---|---|---|
| ||||
|
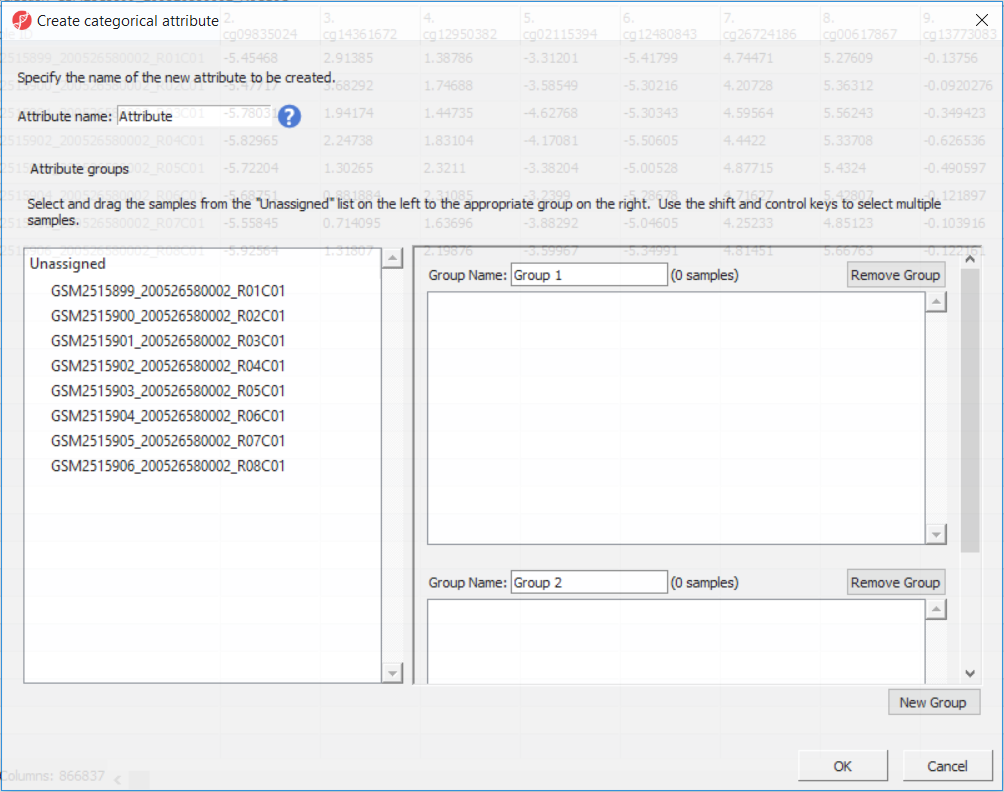
For this analysis, specify Attribute name as HPSC and then create the groups and add samples to them using the table below.
...
Overview
Content Tools