Sankey diagram is a variation of flow diagram, in which the width of the connectors (links) is proportional to the quantity of flow between two connected items (nodes).
In Partek Flow Sankey plots are used to visualize different classes of nucleotide variants (single nucleotide variants or SNVs, as well as indels) and filter variants based on those classes. Sankey plot is automatically created for each Annotated Variants data node and depicts the classification of variants for the selected sample (one at the time) with respect to the particular annotation model (Figure 1).
 Figure 1. Sankey plot showing different classes of variants in the current sample (upper left). The nodes of the plot depend on the annotation database. The width of the links reflects the number of variants. Numbers in the parenthesis correspond to the number of particular variants in each class. Clicking on a node performs filtering
Plot controls are on the left. The first one is the Variant file drop-down list, which is used to display another sample within the same project. The Selected annotations panel shows the annotations that are visible on the plot (as data nodes); to remove one from the plot, select the red minus icon on the right. To add an annotation use the - Add annotation - drop-down list. The sequence of the annotations / nodes from left to right can be changed using the Selected annotation panel, by dragging and dropping the annotation classes. Figure 2 shows the same plot as in Figure 1, after moving the Region class to the left.
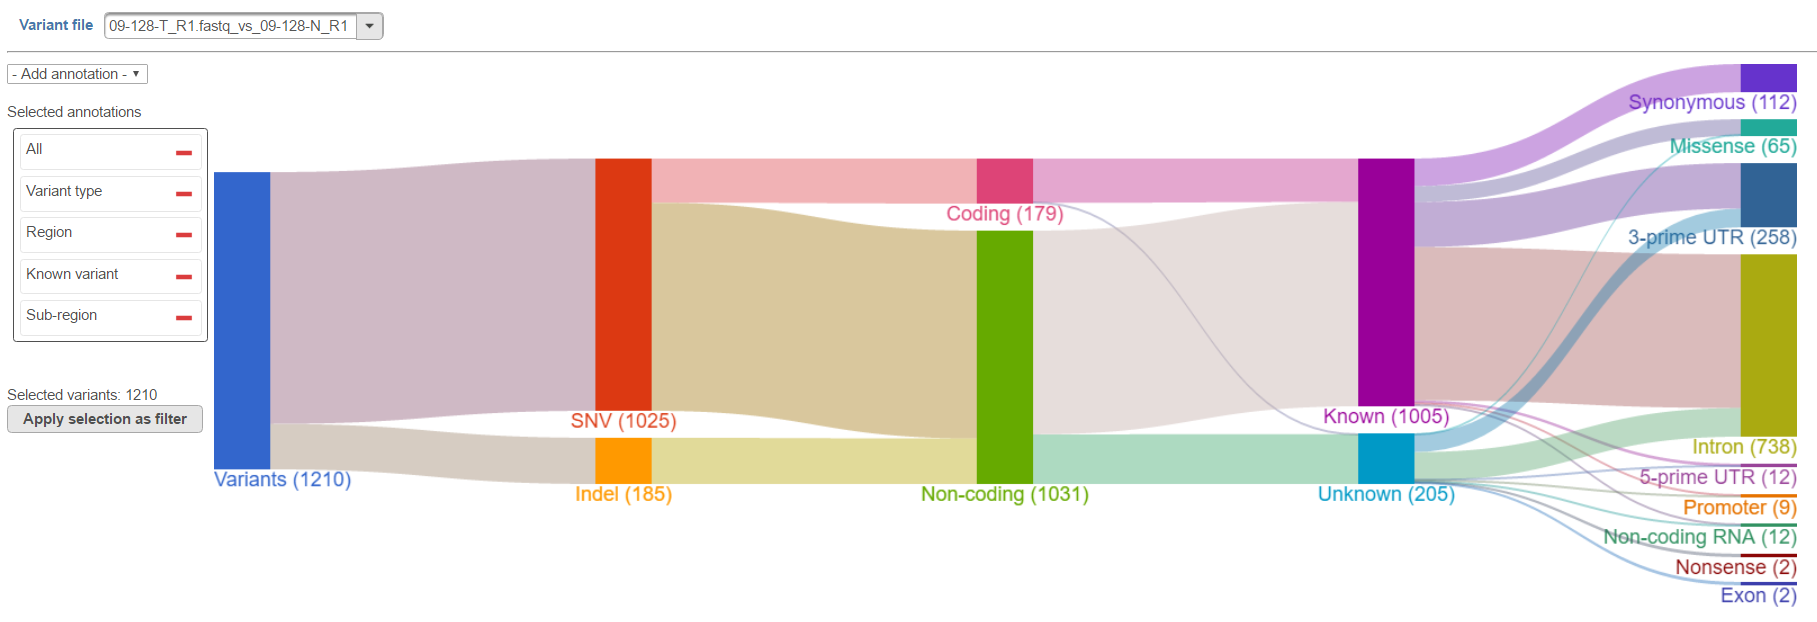 Figure 2. The same Sankey plot as in Figure 1, but with a different order of the nodes
The plot is interactive and acts as a filter tool. Selecting one of the variant classes on the plot (left-click, Control & left-click to select multiple) and then pushing the Apply selection as filter turns on the filter and applies it to the table of variants below the plot. To turn off the filter, click outside the plot. The filter shown in Figure 3 keeps only SNVs in the variant table (i.e. filters out the indels).
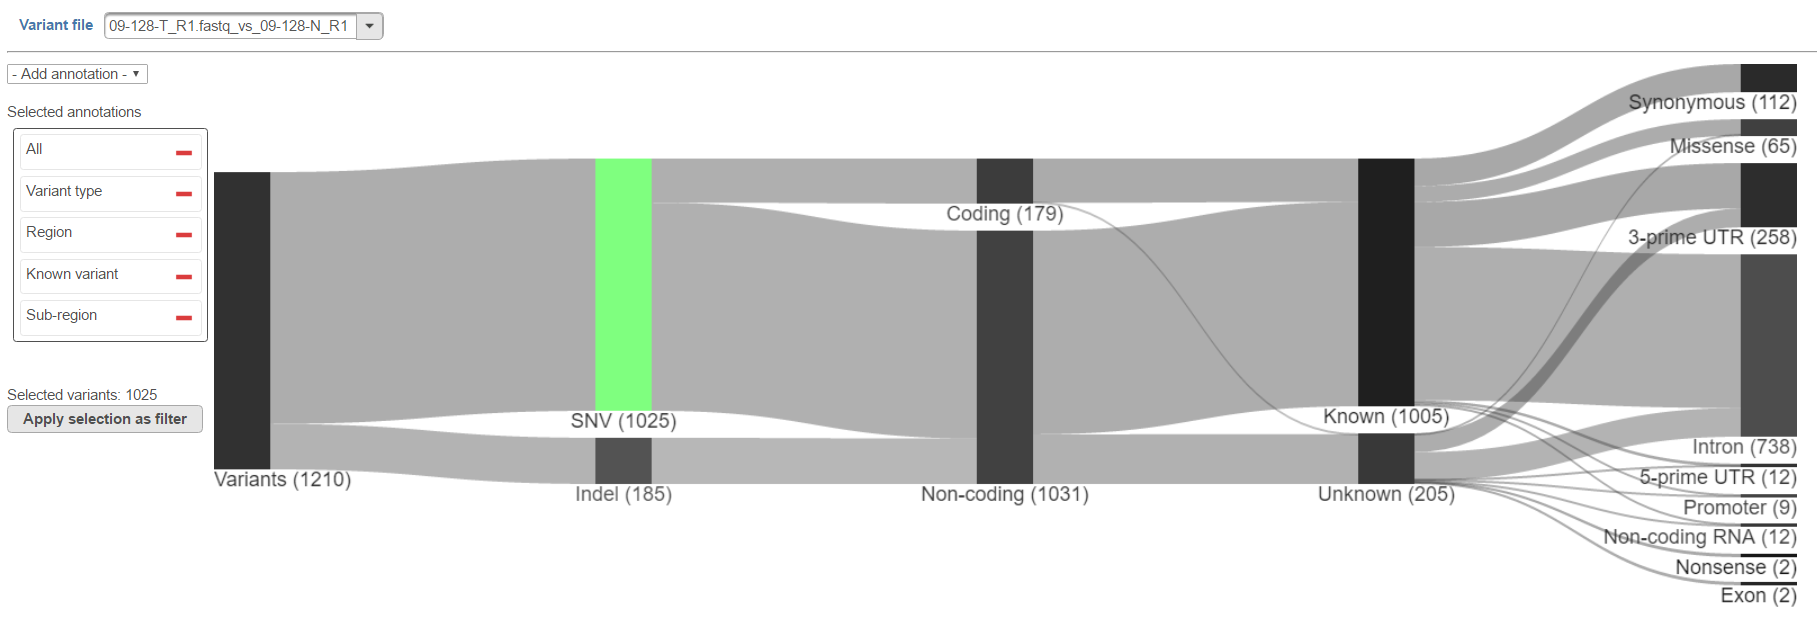 Figure 3. Sankey plot used as a filter tool. Selecting one (or more) variant classes on the plot applies the filter on the variant table. Selected class is highlighted in green. To apply the filter, click on the Apply selection as filter button
Additional Assistance
If you need additional assistance, please visit our support page to submit a help ticket or find phone numbers for regional support.


| Your Rating: |
|
Results: |

|
31 | rates |
Overview
Content Tools