Importing single cell data
Partek Flow supports the import of filtered gene-barcode matrices generated by 10x Genomics' Cell Ranger pipeline.
Below is a video summarizing the import of these files:
Importing matrices into Partek Flow (this Market Exchange Format is popular for public repositories)
To import the matrices into Partek Flow, create a new project and click Add data then select Import scRNA count feature-barcode-mtx under Single cell > scRNA-Seq.
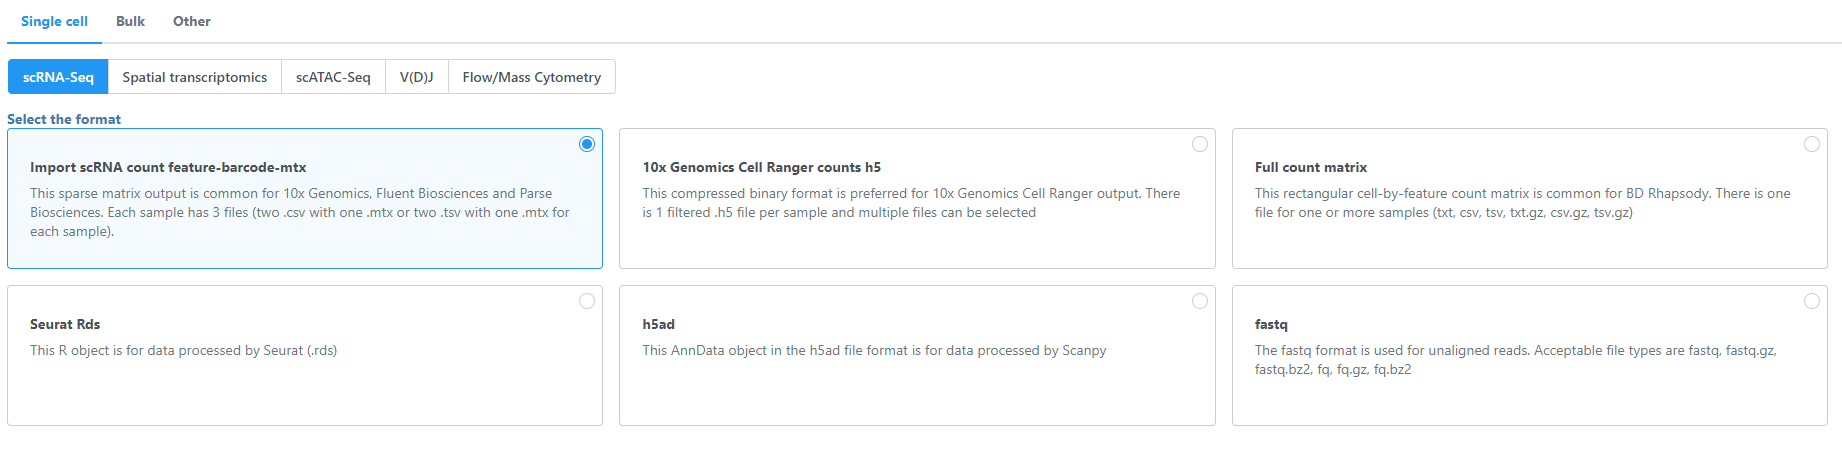 Figure 1. Importing single cell data
Samples can be added using the Add sample button. Each sample should be given a name and three files should be uploaded per sample using the Browse button.
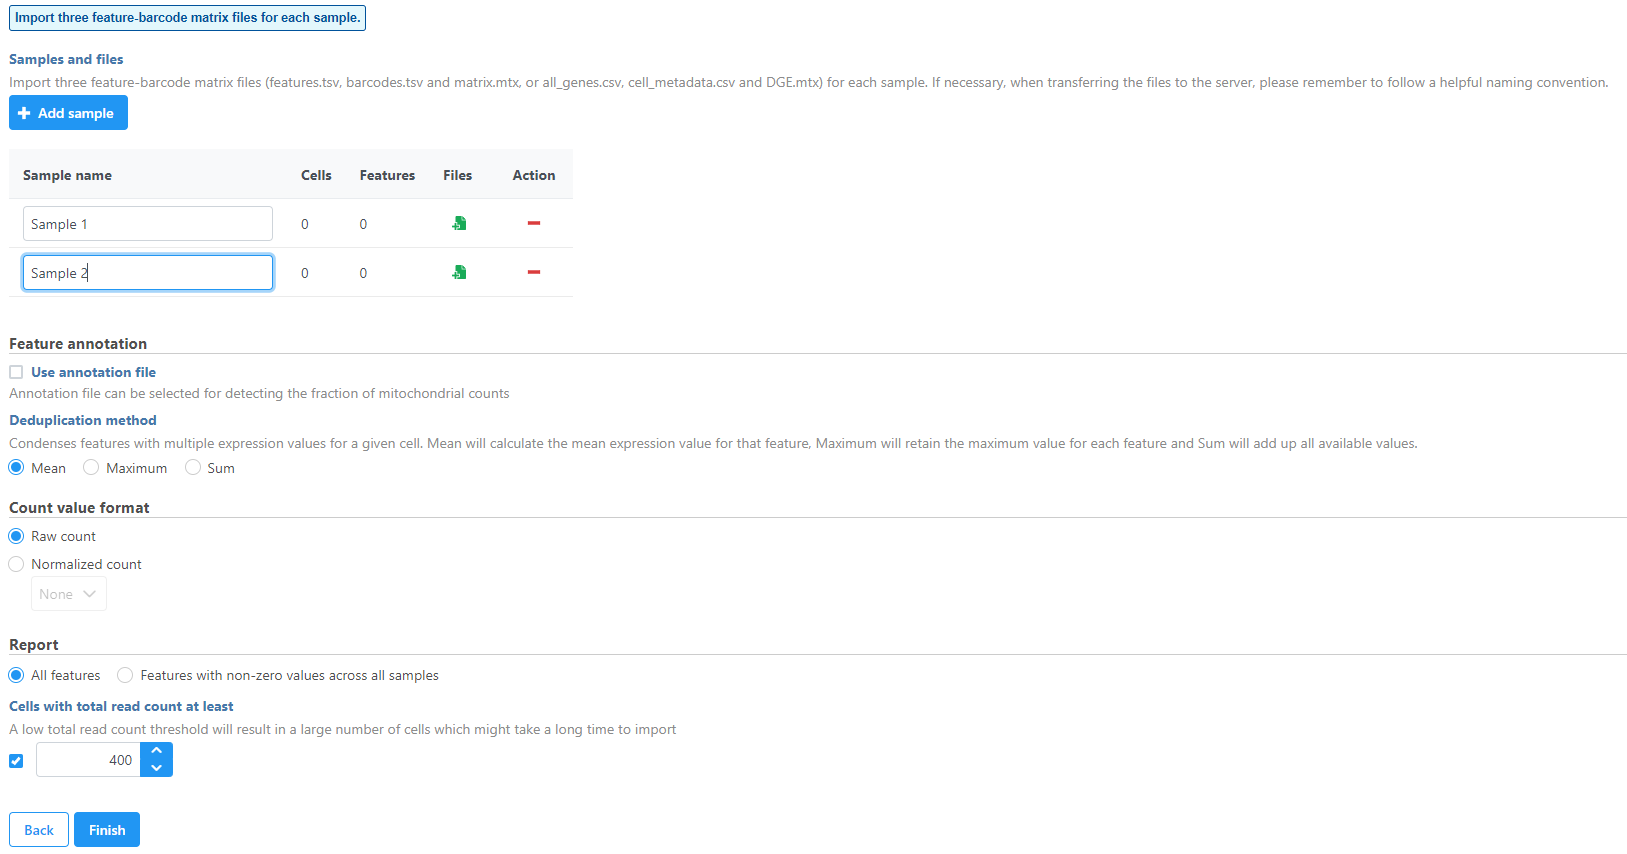
Figure 2. Import three feature-barcode matrix files for each sample
If you have not already, transfer the files to the server to be accessed when you click Browse. Follow the directions here to add files to the server. Make sure the files are decompressed before they are uploaded to the server.
By default, the Cell Ranger pipeline output will have a folder called filtered_gene_bc_matrices (Figure 3). It is helpful to rename and organize the files prior to transfer using the File browser.
There are folders nested within the matrix folder, typically representing the reference genome it was aligned to. Navigate to the lowest subfolder, this should contain three files:
- barcodes.tsv
- genes.tsv
- matrix.mtx
Select all 3 files for import into Partek Flow
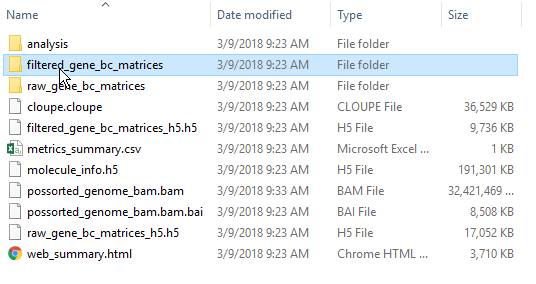
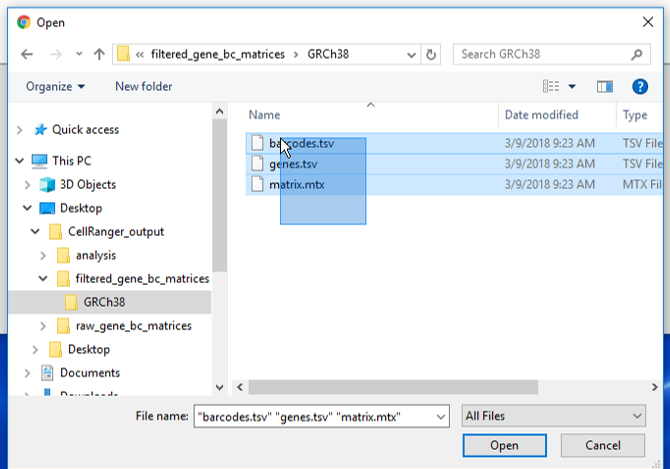 Figure 3. Filtered matrix folder from Cell Ranger pipeline
Specify the annotation file used when running the pipeline for additional information such as mitochondrial counts (Figure 4). Other information can also be specified, such as the count value format. All features can be reported or features with non-zero values across all samples can be reported and the read count threshold can be modified to make the import more efficient.
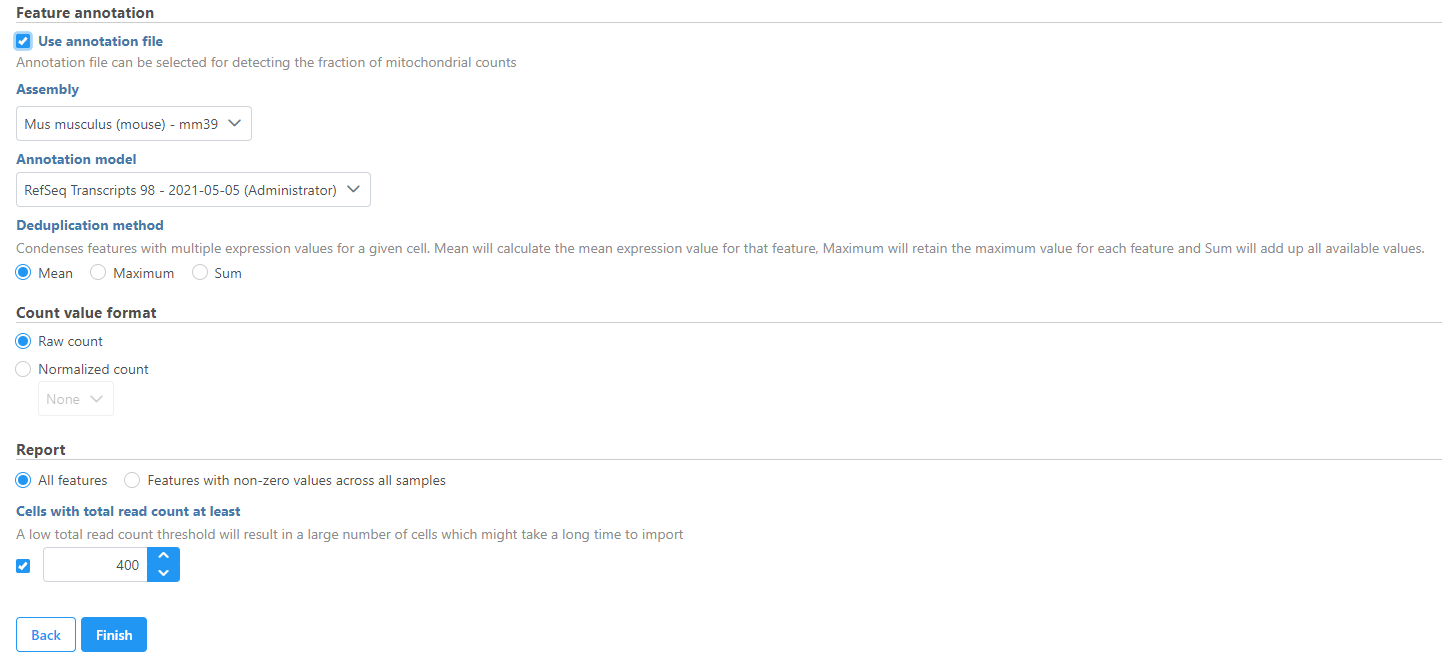 Figure 4. Configuring matrix metadata
Click Finish when you have completed configuration. This will queue the import task.
Importing matrices in h5 format (this Hierarchical Data Format is recommended for multiple samples)
The Cell Ranger pipeline can also generate the same filtered gene barcode matrix in h5 format. This gives you the ability to select just one file per matrix and select multiple matrices to import in batch. To import an h5 matrix, select the Import scRNA full count matrix or h5 option (Figure 1). Browse for the files and modify any configuration options. Remember the files need to be transferred to the server.
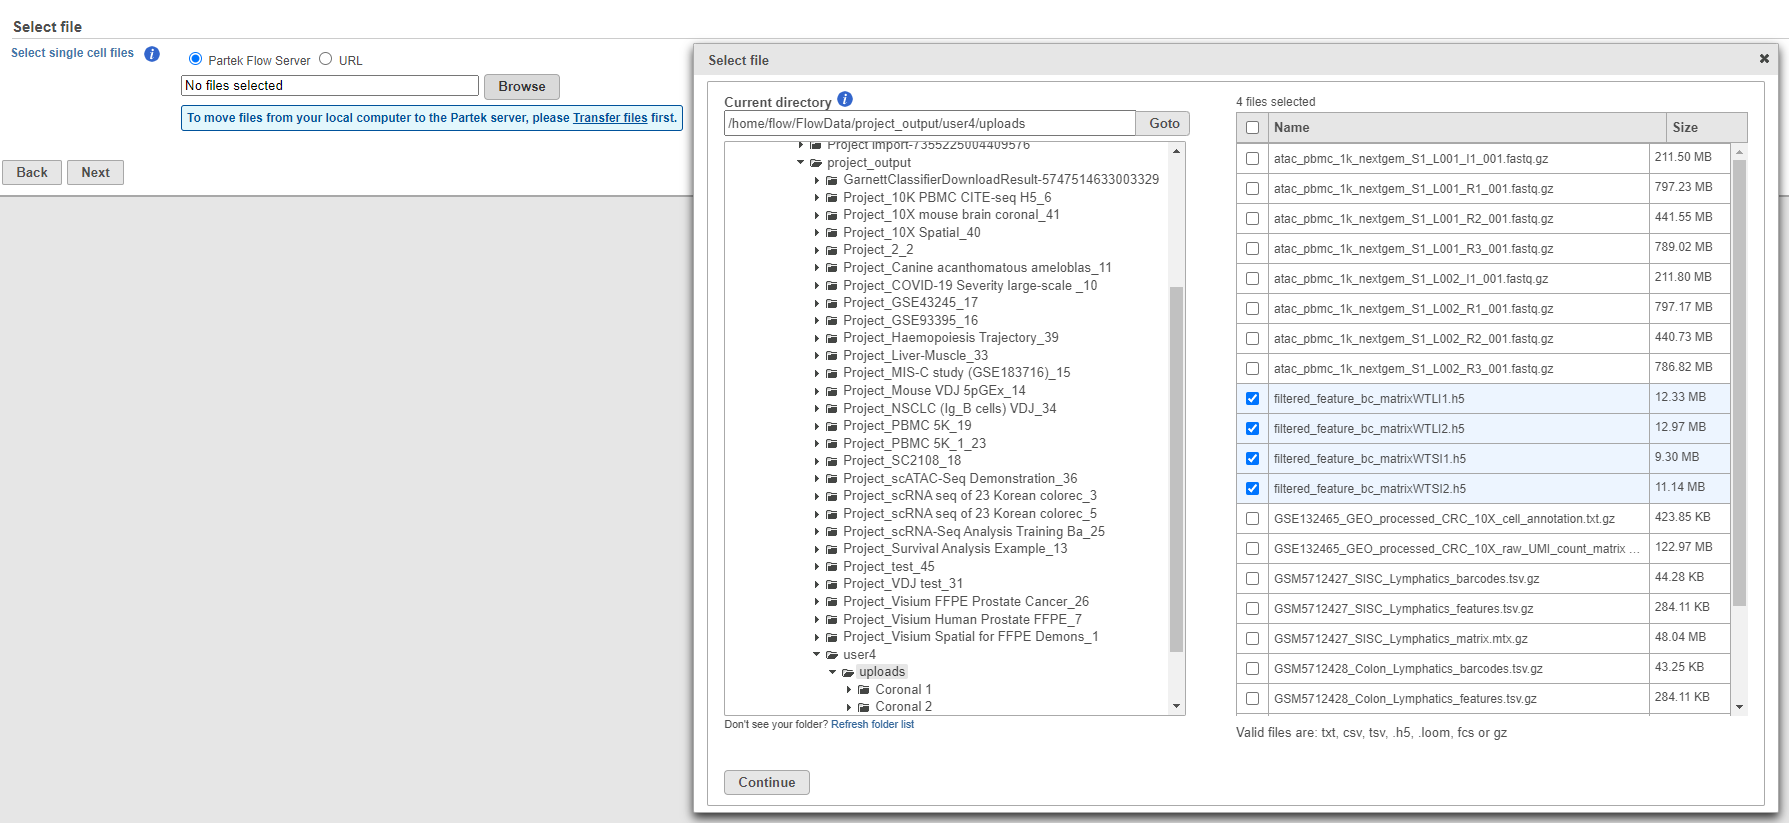 Figure 5. Importing matrix in h5 format
This feature is also useful for importing multiple samples in batch. Simply put all h5 files from your experiment on a single folder, navigate to the folder and select all the matrices you would like to import.
Configure all the relevant sample metadata, including sample name and the annotation that was used to generate the matrices, and click Finish when completed. Note that all matrices must have been generated using the same reference genome and annotation to be imported into the same project.
Importing spatial data
Importing Xenium Output Bundle
Raw output data generated by the 10x Genomics' Xenium Onboard Analysis pipeline consists of decoded transcript counts and morphology images. The raw output and other standard output files derived from them are compiled into a zipped file called Xenium Output Bundle.
To import the Xenium Output Bundle into Partek Flow, create a new project and click Add data, then select Import 10x Genomics Xenium under Single cell > Spatial, click Next.
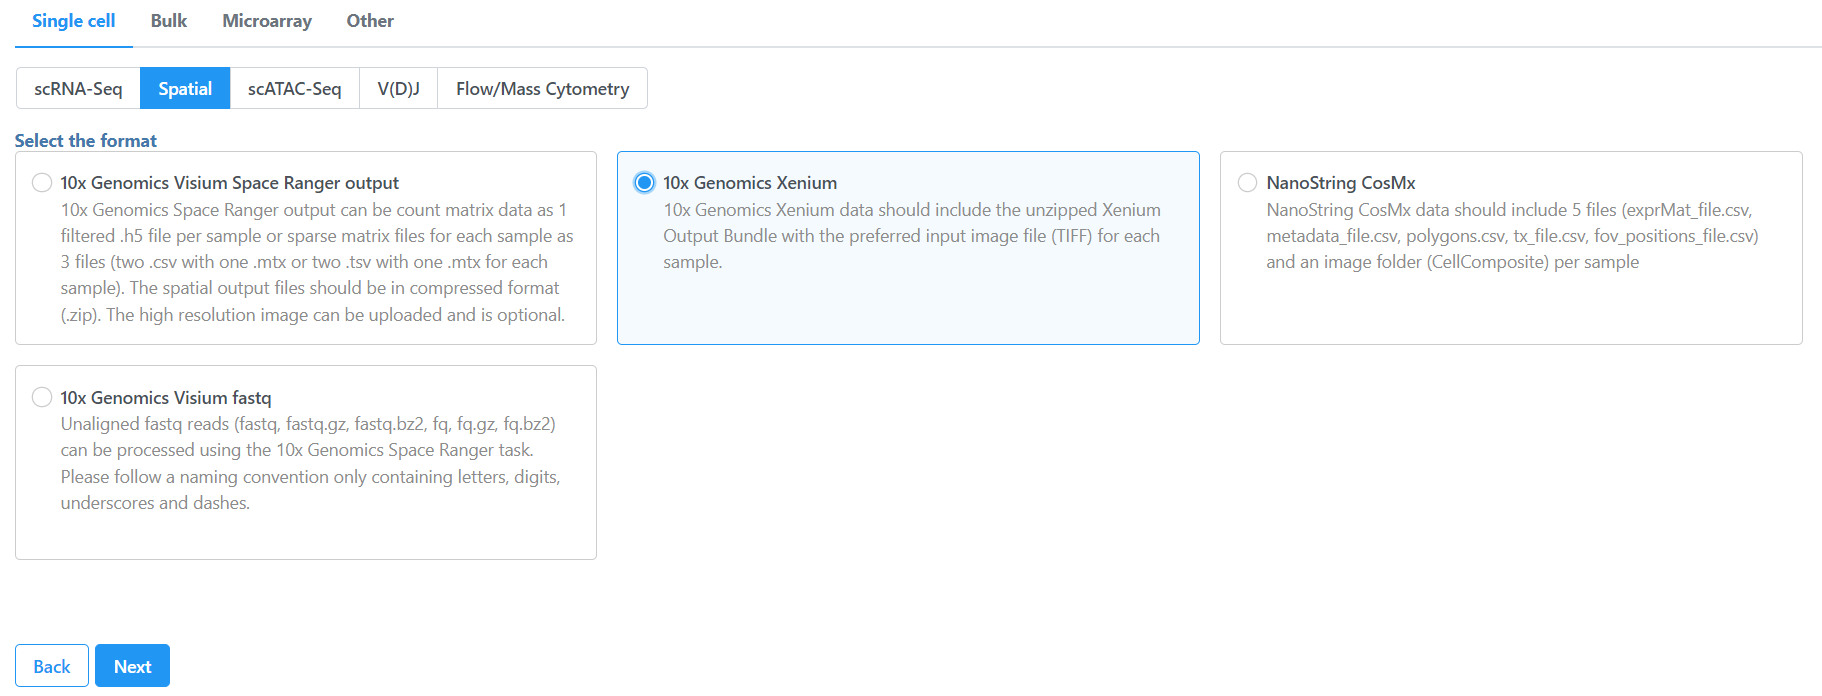 Figure 6. Importing Xenium spatial data
Samples can be added using the Add sample button. Each sample should be given a name and a folder containing the required 6 files: cell_feature_matrix.h5, cells.csv.gz, cell_boundaries.csv.gz, nucleus_boundaries.csv.gz, transcripts.csv.gz, morphology_focus.ome.tif should be uploaded per sample using the Browse button. The required 6 files should be all included in the Xenium Output Bundle folder.
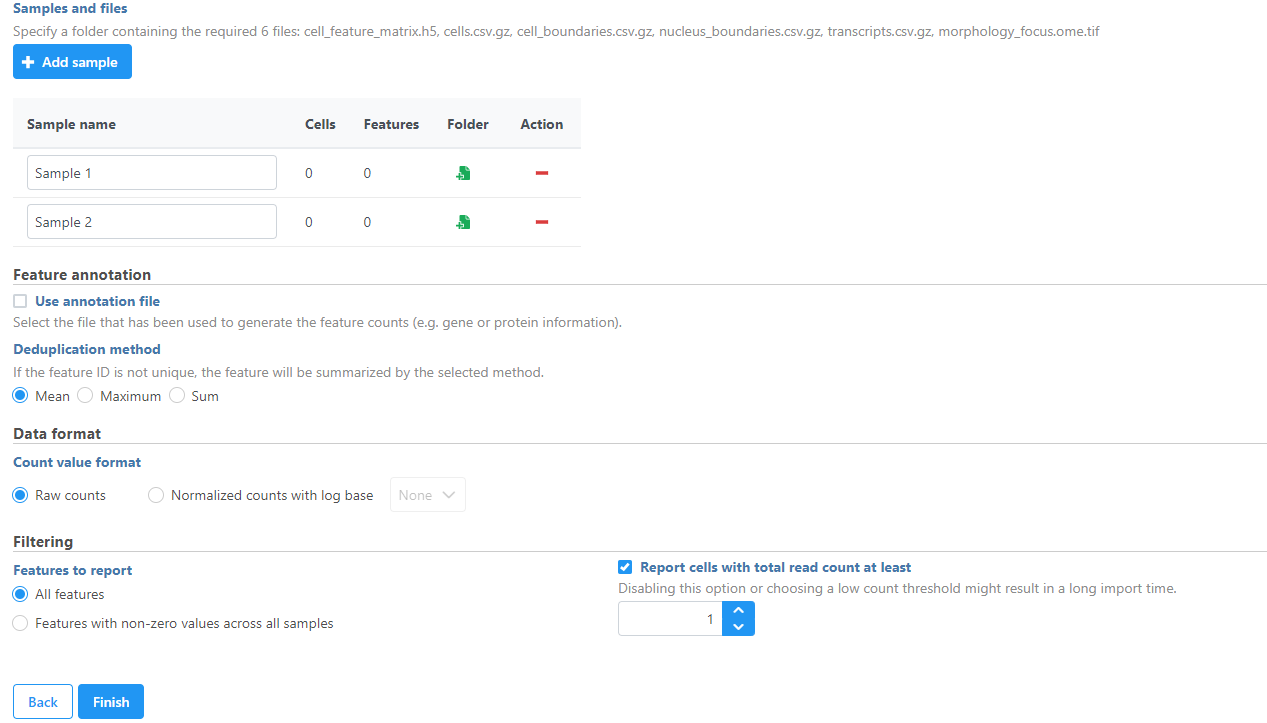
Figure 7. Import Xenium Output Bundle folder for each sample
If you have not already, transfer the files to the server to be accessed when you click Browse. Follow the directions here to add files to the server. You will need to decompress the Xenium Output Bundle zip file before they are uploaded to the server. After decompression, you can drag and drop the entire folder into the Transfer files dialog, all individual files in the folder will be listed in the Transfer files dialog after drag & drop, with no folder structure. The folder structure will be restored after upload is completed.
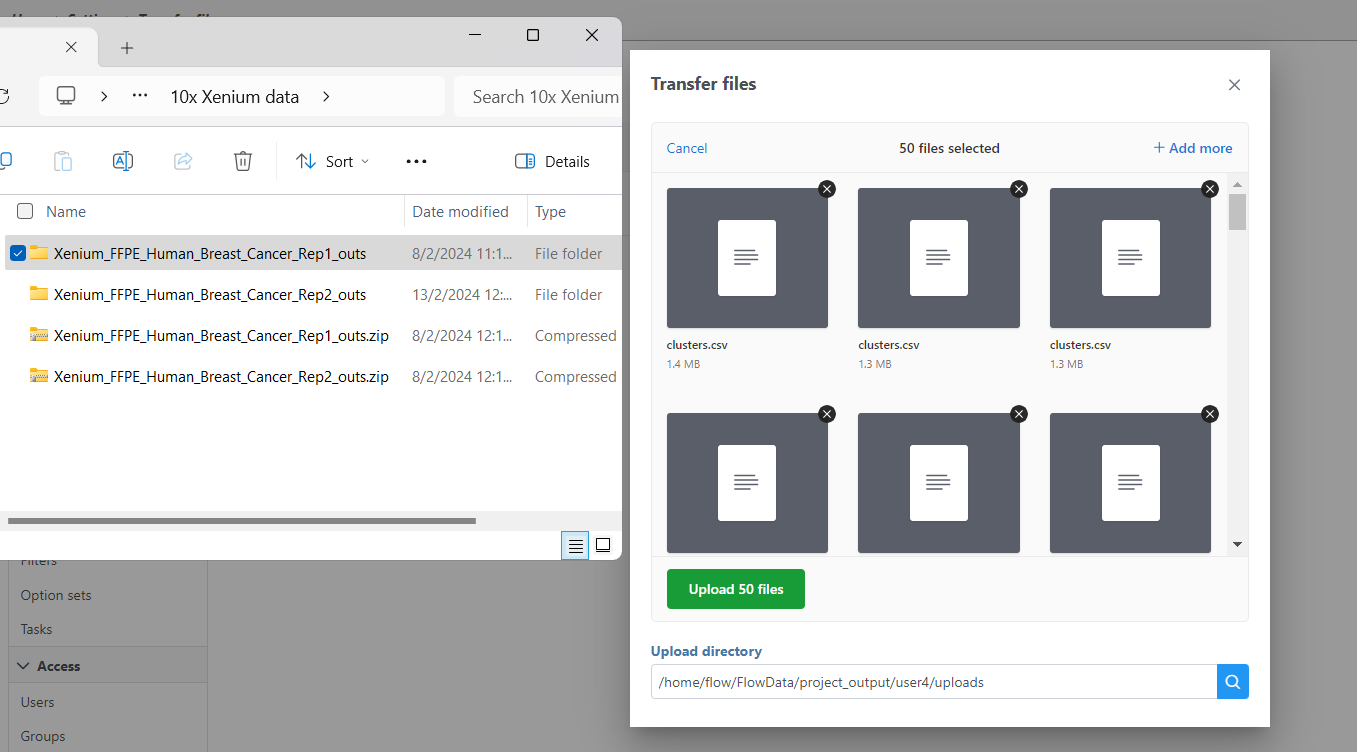
Figure 8. Drag & drop unzipped Xenium Output Bundle folder into Transfer files dialog
Once you have uploaded the folder into the server, you can continue to select the folder for each sample from Browse. Once the folder is selected, the Cells and Features values will auto-populate. You can choose an annotation file that matches what was used to generate the feature count. Then, click Finish to start importing the data into your project.
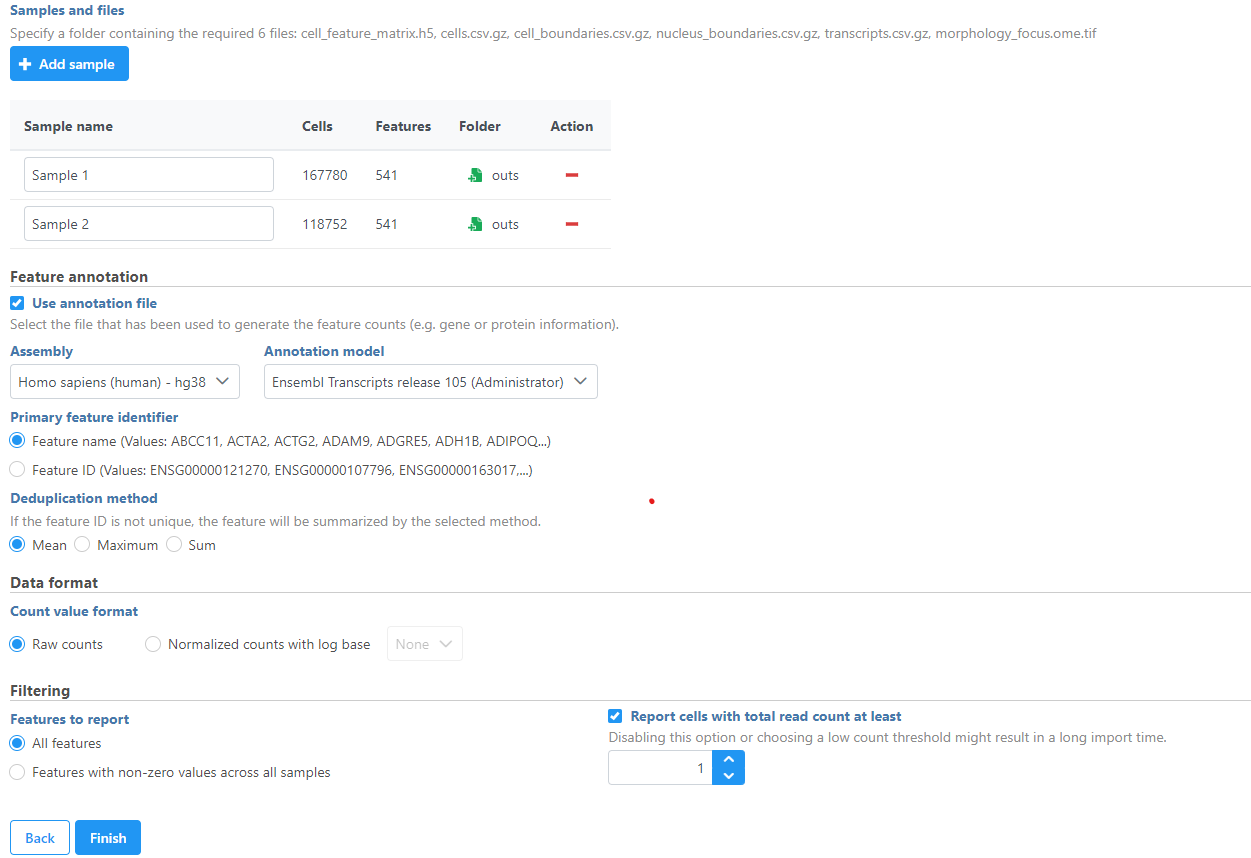
Figure 9. Add Xenium Output Bundle and select annotation
Additional Assistance
If you need additional assistance, please visit our support page to submit a help ticket or find phone numbers for regional support.


| Your Rating: |
|
Results: |

|
26 | rates |
Overview
Content Tools