Partek Flow offers the DESeq2 method for differential expression detection. There are two options DESeq2(R) and DESeq 2.
DESeq2(R) is a wrapper of Bioconductor package ‘DESeq2’. The implementation details for DESeq2(R) can be found at the external DESeq2 documentation page, which includes changes made by the algorithm authors since the publication of the original manuscript (Love, Huber, and Anders 2014).
The DESeq2(R) task can be invoked from data nodes generated by quantification tasks that contains raw read count values for each feature in each sample (Gene counts, Transcript counts, microRNA counts, etc.). DESeq2(R) cannot be run on a normalized counts data node because DESeq2(R) internally corrects for library size and implements a low expression filter.
If the value of the raw count includes a decimal fraction, the value will be rounded to an integer before DESeq2(R) is performed. The DESeq2(R) task itself includes feature filter, normalization and differential analysis. Please note that when you run DESeq2(R) task, you have to install the R package before hand (the installation has to be performed outside of Partek Flow).
DESeq2 task, on the other hand, is a Partek Flow native implementation of DESeq2 differential expression detection algorithm, it is much faster than DESeq2(R). Like GSA and ANOVA, before you run this task, we recommend that you first remove (filter out) features expressed at a low level and then perform normalization using Median ratio (DESeq2 only).
Note: DESeq2 differential analysis can only be performed on the following normalization output data node, those methods can produce library sizes:
TMM, CPM, Upper Quartile, Median ratio, Postcounts
Installation of R is not required to run DESeq2 task.
Configuring DESeq2/DESeq2(R)
Categorical and numeric attributes, as well as interaction terms can be added to the DESeq2 model. The DESeq2 configuration dialog for adding attributes and interactions to the model is very similar to the ANOVA configuration dialog. However, DESeq2(R) has two important limitations not shared by GSA or ANOVA/LIMMA-trend/LIMMA-voom.
First, interaction terms cannot be added to contrasts in DESeq2(R). In order to perform contrasts of an interaction term in DESeq2(R), a new attribute that combines the factors of interest must be added and the contrast performed on the new combined attribute. This limitation of DESeq2(R) is detailed in the official DESeq2 documentation page. To perform contrasts of interaction terms without creating new combined attributes, please use either DESeq2, GSA, or ANOVA/LIMMA-trend/LIMMA-voom method.
Second, DESeq2(R) only allows two subgroups to be compared in each contrast. To analyze multiple subgroups, please use either DESeq2, GSA, or ANOVA method.
In DESeq2 advanced options configure dialog, there is reference selection option:

A reference level is specified for each categorical factor in the model and the result may be dependent on the choice. In R, the reference level is typically chosen by default whenever a categorical factor is present in the model. This Flow option was created to allow the user to specify exactly the same reference level as in her R script, if need be.
DESeq2/DESeq2(R) report
The report produced by DESeq2 is similar to the ANOVA report; each row is a feature and columns include p-value, FDR p-value, and fold change in linear scale for each contrast. However DESeq2(R) report doesn't have LSMeans information on the compared groups.
Handling of special cases in DESeq2
The R implementation of DESeq2 and DESeq2(R) fail to generate results in some special cases of input data that are handled differently in Partek's implementation of DESeq2.
First, if two or more categorical factors are present in the model, there can be a situation when some combinations of factor levels have no observations. In Flow, one can see if that is the case by clicking "Cross tabulation" link after the factors have been selected:
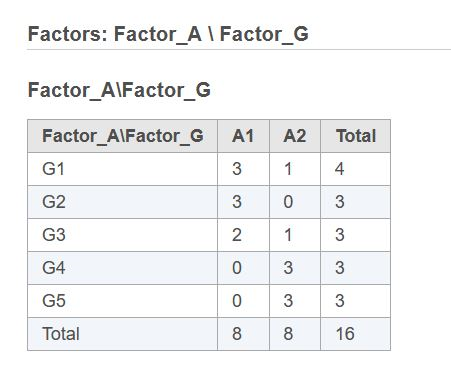
In this example, if the user tries to fit the model including Factor_A, Factor_G, and Factor_A*Factor_G terms, R implementation of DESeq2 fails. At the same time, none of these three terms is completely redundant, even though not all contrasts are estimable. It is possible to obtain an answer in R only by combining Factor_A and Factor_G into a single new factor with no empty levels. Partek's implementation of DESeq2 eliminates the need for that extra step and produces an answer right away. However, the results (most likely, p-values) may be somewhat different from what one would obtain by using a combined factor in R. To match R results perfectly, one has to create a combined factor in Flow also.
Second, occasionally all of the gene-wise dispersion estimates are too close to zero. In that case, R implementation fails with an error message "all gene-wise dispersion estimates are within 2 orders of magnitude from the minimum value ... one can instead use the gene-wise estimates as final estimates". As suggested in the error message, Flow implementation uses gene-wise dispersion estimates instead of failing the task.
In all of the special cases, an informative warning is output in Flow log.
Fold change shrinkage in DESeq2
In R, shrinkage of log2 fold changes is a separate step performed by lfcShrink() function. In Flow, that functionality is absent in DESeq(R) but present in DESeq2 task. The latter implements the shrinkage method corresponding to “ashr” option in lfcShrink(). The default shrinkage option in lfcShrink is “apeglm”, but the default method is unable produce results for some comparisons whereas “ashr” has no restrictions. The fold change shrinkage results are produced in “Shrunken Log2(Ratio)” and “s-value” columns in DESeq2 task project report.
Troubleshooting
In addition to the issues addressed in Differential Analysis Troubleshooting, DESeq2 may generate missing values in the multiplicity adjustment columns (such as FDR) if "independent filtering" is enabled in Advanced Options:

"Independent filtering" tries removing some features with low expression in order to increase the statistical power. For such removed features, the p-value is reported but FDR and similar multiplicity adjustment measures are set to "?". In order to avoid the missing values in the report, set the option to "No".
Since there is limitation in DESeq2(R), we recommend to use DESeq2 task all the time.
References
Love MI, Huber W, and Anders S. Moderated estimation of fold change and dispersion for RNA-seq data with DESeq2. Genome Biology 2014;15(12): 550.
Additional Assistance
If you need additional assistance, please visit our support page to submit a help ticket or find phone numbers for regional support.


| Your Rating: |
|
Results: |

|
37 | rates |
Overview
Content Tools