Introduction
The Choose taxonomic level task generates a count matrix summarizing the number of reads that have been classified by Kraken for each taxon in each sample, at a given taxonomic level. The counts give a measure of the relative abundance of each taxon, which can be used for downstream analysis and visualization as if it were gene expression count data.
Running the Choose Taxonomic Level Task
The task can be performed on a Taxonomic data node, which is the output from a Kraken task.
- Click a Taxonomic data node
- Choose Choose taxonomic level from the Metagenomic section of the toolbox
- Check one or more taxonomic levels. The options are Superkingdom, Kingdom, Phylum, Class, Order, Family, Genus, or Species (Figure 1). A separate output data node will be generated for each one that is selected (Figure 2)
- Click Finish
The choice of taxonomic level depends on which level you want to perform downstream analysis on and your research question. For example, if you want to know which families of bacteria are the most abundant in your sample, choose the family level. If you want to see which species are differentially abundant in different groups of samples, choose the species level.
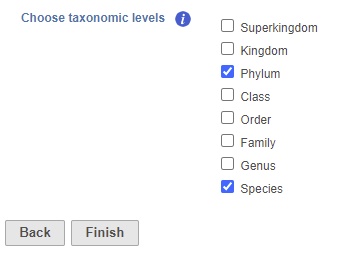 Figure 1. Choose taxonomic level task set up page. Check one or more boxes
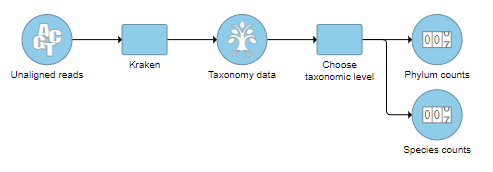 Figure 2. One output data node is produced for each taxonomic level chosen
Download a count matrix
To export the count matrix for a taxonomic level, select the output data node and choose Download data from the toolbox. You can choose to put the features on the columns or rows (Figure 3). The 'features' in this context are the taxa. For example, if a Phylum data node is downloaded, the features will be different phyla. The download will be a tab-delimited text file with read counts for each sample (Figure 4).
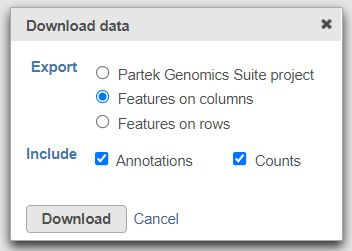 Figure 3. Download the matrix of read counts for each taxon per sample
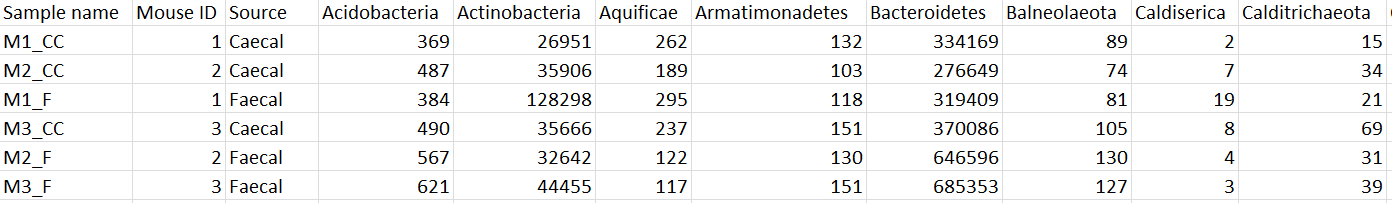 Figure 4. Example of Phylum-level count matrix with features (phyla) on columns. Column 1 is the sample name. Columns 2 & 3 are sample attributes. Columns 4+ are different phyla. The counts are the number of reads that have been classified for each phylum, for each sample
Downstream Analysis
The taxon-level count data node(s) behave like any other count matrix in Partek Flow. This means you can perform most of the tasks you would normally perform on gene expression data. For example, you can normalize the counts, perform principal components analysis (PCA), and use ANOVA to detect differentially abundant species in different groups of samples (Figure 5). Additional visualizations can also be generated including heatmaps, volcano plots, dot plots, and more.
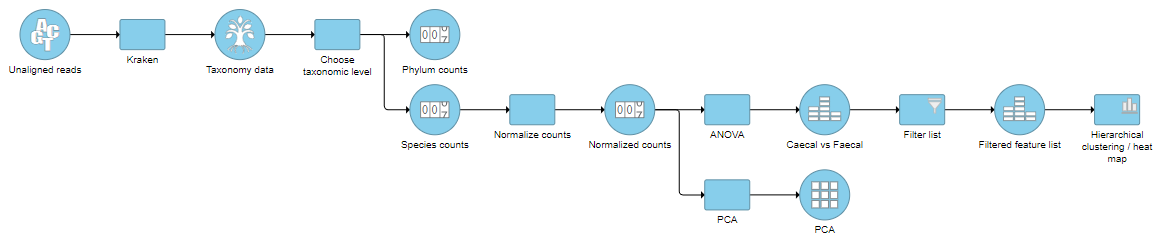 Figure 5. An example pipeline of some downstream tasks that can be performed on taxon-level count data
Additional Assistance
If you need additional assistance, please visit our support page to submit a help ticket or find phone numbers for regional support.


| Your Rating: |
|
Results: |

|
12 | rates |
Overview
Content Tools