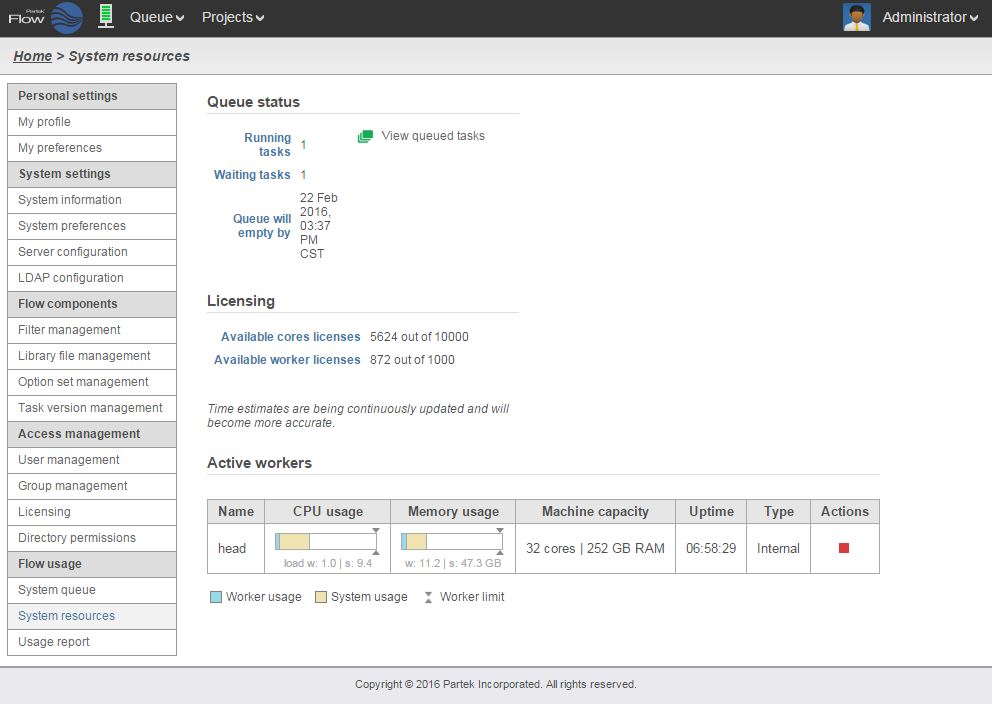
The System resources page gives users information about the hardware resources available for use in their Partek® Flow® server.
The Queue status section indicates the number tasks currently running as well as the number of waiting tasks. These include tasks that are waiting for system resources to be available or for an upstream task to complete. Queue will empty by gives an estimated time of completion for all queued tasks. Click on the button to display queued tasks.
The Licensing section summarizes the number of Available cores licenses and Available worker licenses. Contact your Account Manager to obtain additional core or worker licenses.
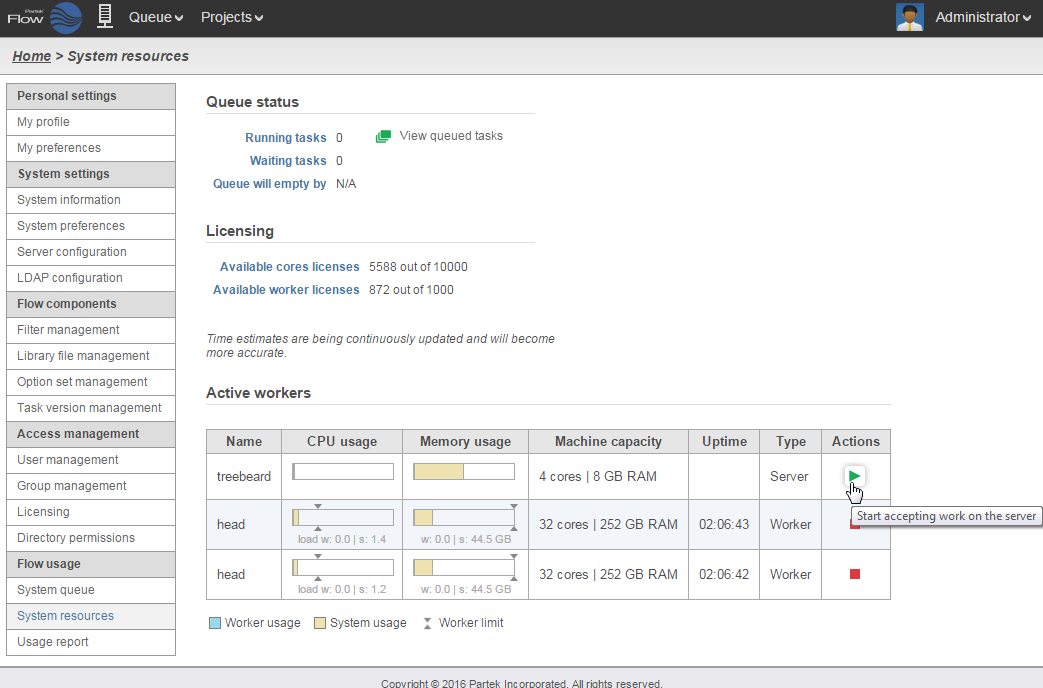
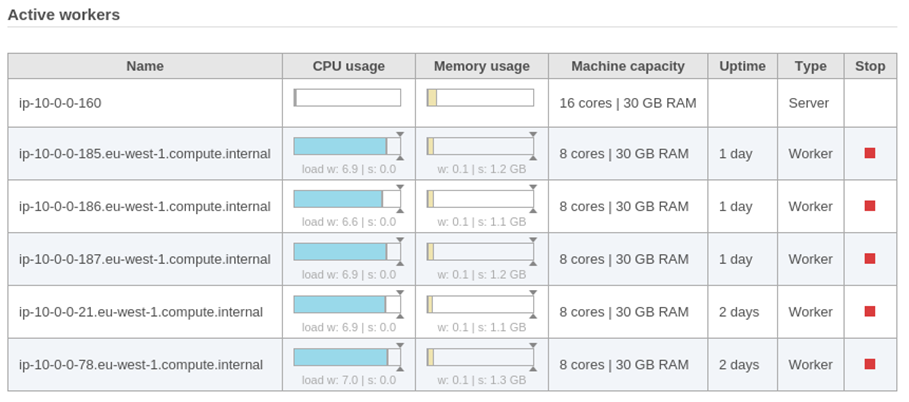
The Active workers table lists one active worker node per row (an example with a single worker is shown in Figure 1) and contains performance metrics for worker processes and server processes. The columns provide the following information:
Name: worker’s identifier (IP address or name)
CPU usage: the computational load of the worker process
Memory usage: the memory usage of the worker process
Machine capacity: indicates the number of cores and amount of RAM available to the worker
Uptime: the duration that the worker has been running
Type: the type of worker (described below)
Actions: selecting the stops a worker while selecting starts a worker (Figure 3)
Additional Assistance
If you need additional assistance, please visit our support page to submit a help ticket or find phone numbers for regional support.


| Your Rating: |
    
|
Results: |
    
|
0 | rates |


