Filter Groups
Because we have classified our cells, we can now filter based on those classifications. This can be used to focus on a single cell type for re-clustering and sub-classification or to exclude cells that are not of interest for downstream analysis.
- Click the Classified result data node
- Click Filtering
- Click Filter groups
- Set to exclude Cell type is Doublets using the drop-down menus
- Click AND
- Set the second filter to exclude Cell type is N/A using the drop-down menus
- Click Finish to apply the filter (Figure ?)
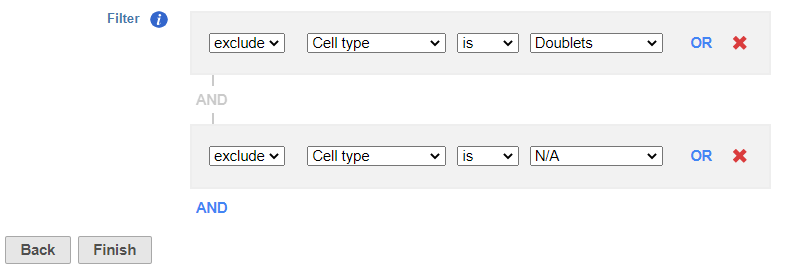 Figure 1. Set up the Filter groups task to exlcude Doublets and cells that are not classified
This produces a Filtered counts data node (Figure ?).
Figure 1. Set up the Filter groups task to exlcude Doublets and cells that are not classified
This produces a Filtered counts data node (Figure ?).
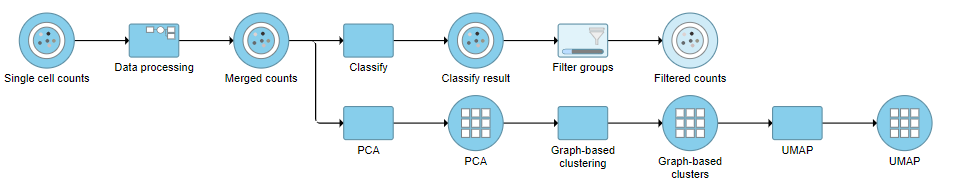 Figure 2. Filter groups output
Re-split the Matrix
For this tutorial, we will re-split the protein and gene expression data prior to performing differential analysis, you may want to separate your protein and gene expression data. The split data nodes will both retain cluster and classification information.
- Click the Classified groups data node
- Click Pre-analysis tools
- Click Split matrix
This will produce two data nodes, one for each data type
Differential Analysis and Visualization - Protein Data
Differential Analysis, Visualization, and Pathway analysis - Gene Expression Data
Additional Assistance
If you need additional assistance, please visit our support page to submit a help ticket or find phone numbers for regional support.


| Your Rating: |
|
Results: |

|
0 | rates |
Overview
Content Tools