What is Kraken?
Kraken is a taxanomic sequence classifier that assigns taxonomic labels to short DNA sequences, typically from microbiome or metagenomic studies [1]. Kraken classifies reads to a best-match location in a taxonomic tree (the lowest common ancestor), so not all sequences will be classified to a particular level such as species. Kraken matches k-mers (nucleotide sequences of k bases in length) within a read to a database database of k-mer sequences from known genomes with established taxonomic relationships to perform its classifications.
Running Kraken
Kraken tasks FASTQ files as input.
- Click a data node with FASTQ files
- Click the Metagenomics section of the toolbox
- Click Kraken
- Choose a Kraken database
- Configure parameters
- Click Finish to run (Figure 1)
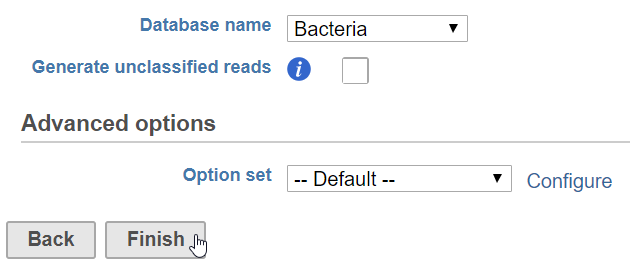
Figure 1. Configuring Kraken
Kraken generates a Classified sequence data node. This data type is the input for the Alpha & beta diversity task.
Kraken parameters
Database name
Partek distributes the Kraken databases Bacteria, Human, Plasmids, Viruses, and MiniKraken. MiniKraken includes sequences from bacterial, archaeal, and viral genomes in RefSeq, however, it contains only 2.7% of the k-mers from the original database. Running Kraken using the MiniKraken database is significantly faster and less resource-intensive than using a full database, but will not give as complete a result.
Generate unclassified reads
If enabled, an Unaligned reads data node including reads that could not be classified by Kraken is produced. Default is Disabled.
Advanced options - Quick operation
If enabled, uses the first hit or hits (--quick). Default is Disabled.
Kraken task report
The Kraken task report presents a table and graph summarizing the results (Figure 2)
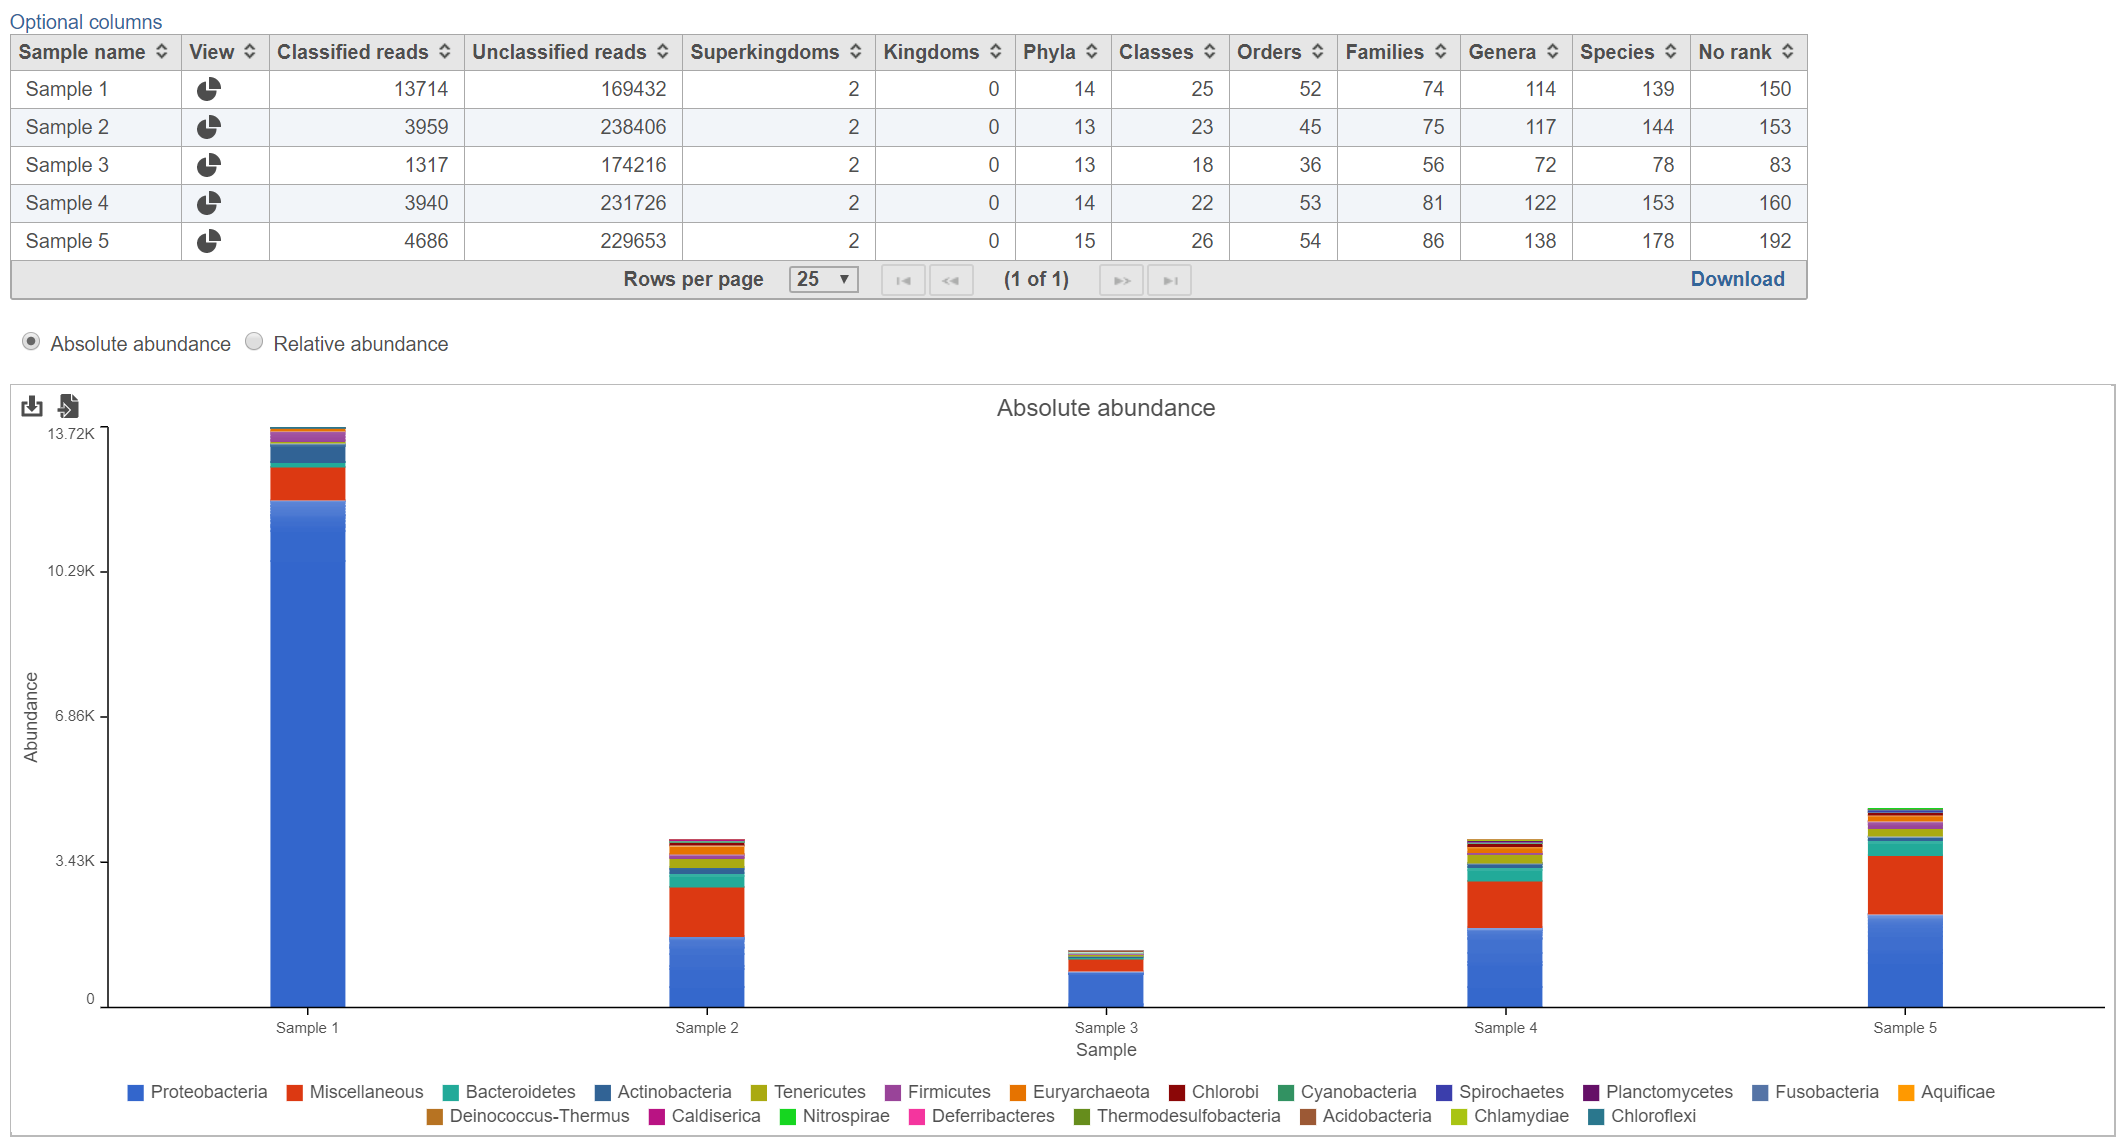
Figure 2. Kraken task report
Table
The table lists each sample and gives the following values:
Classified reads
The number of reads that were classified by Kraken for each sample.
Unclassified reads
The number of reads that were not classified by Kraken for each sample.
Taxonomic levels columns (Superkingdom, Kingdom, Phyla, Classes, Orders, Families, Genera, Species, No rank)
Lists the number of different values are represented for each taxonomic level among the classified reads for each sample.
Bar chart
The stacked bar chart shows the abundance or relative abundance of the different phyla. The legend lists the color of each phyla. Mouse over a bar to view the breakdown of classes within the phyla (Figure 3). Use the radio button to switch between Absolute abundance and Relative abundance.
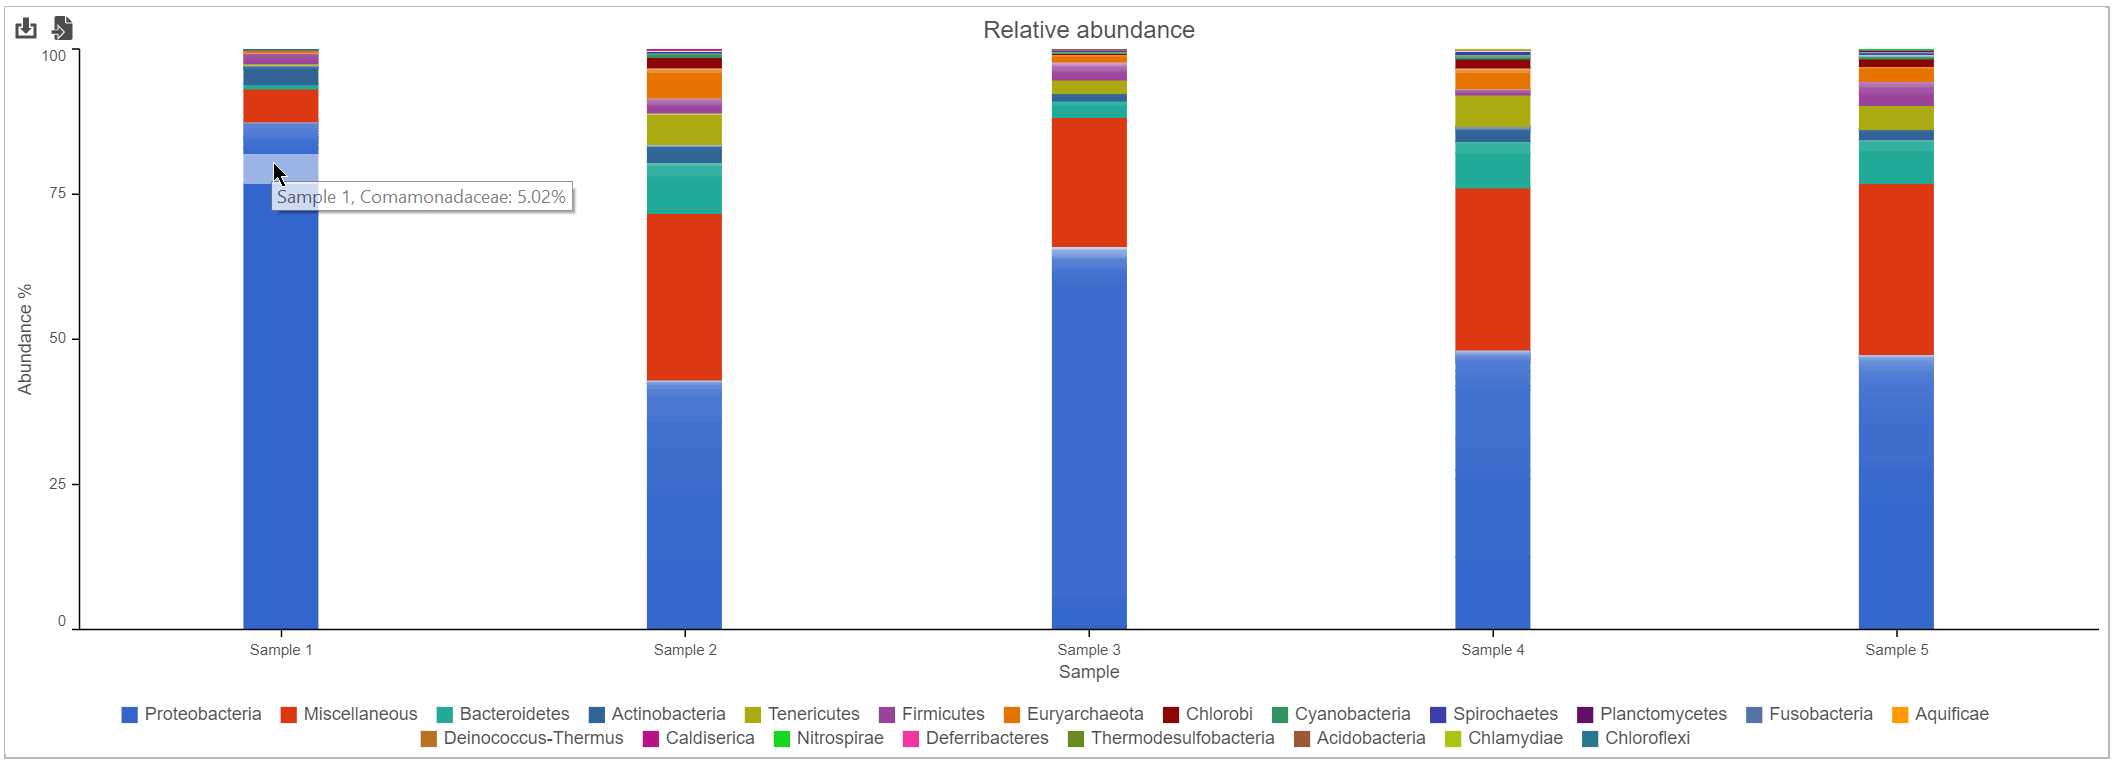
Figure 3. Kraken task report bar chart
Hierarchical pie chart
Click the ![]() in the View column of the table opens an interactive Hierarchical pie chart that can be used to explore the taxonomies present in each sample (Figure 4). Mousing over a section of the pie chart gives the number of reads classified to this level, the number of reads in its children, the percentage of total reads represented by this group, and the percentage of the reads in the root that are represented by this group.
in the View column of the table opens an interactive Hierarchical pie chart that can be used to explore the taxonomies present in each sample (Figure 4). Mousing over a section of the pie chart gives the number of reads classified to this level, the number of reads in its children, the percentage of total reads represented by this group, and the percentage of the reads in the root that are represented by this group.
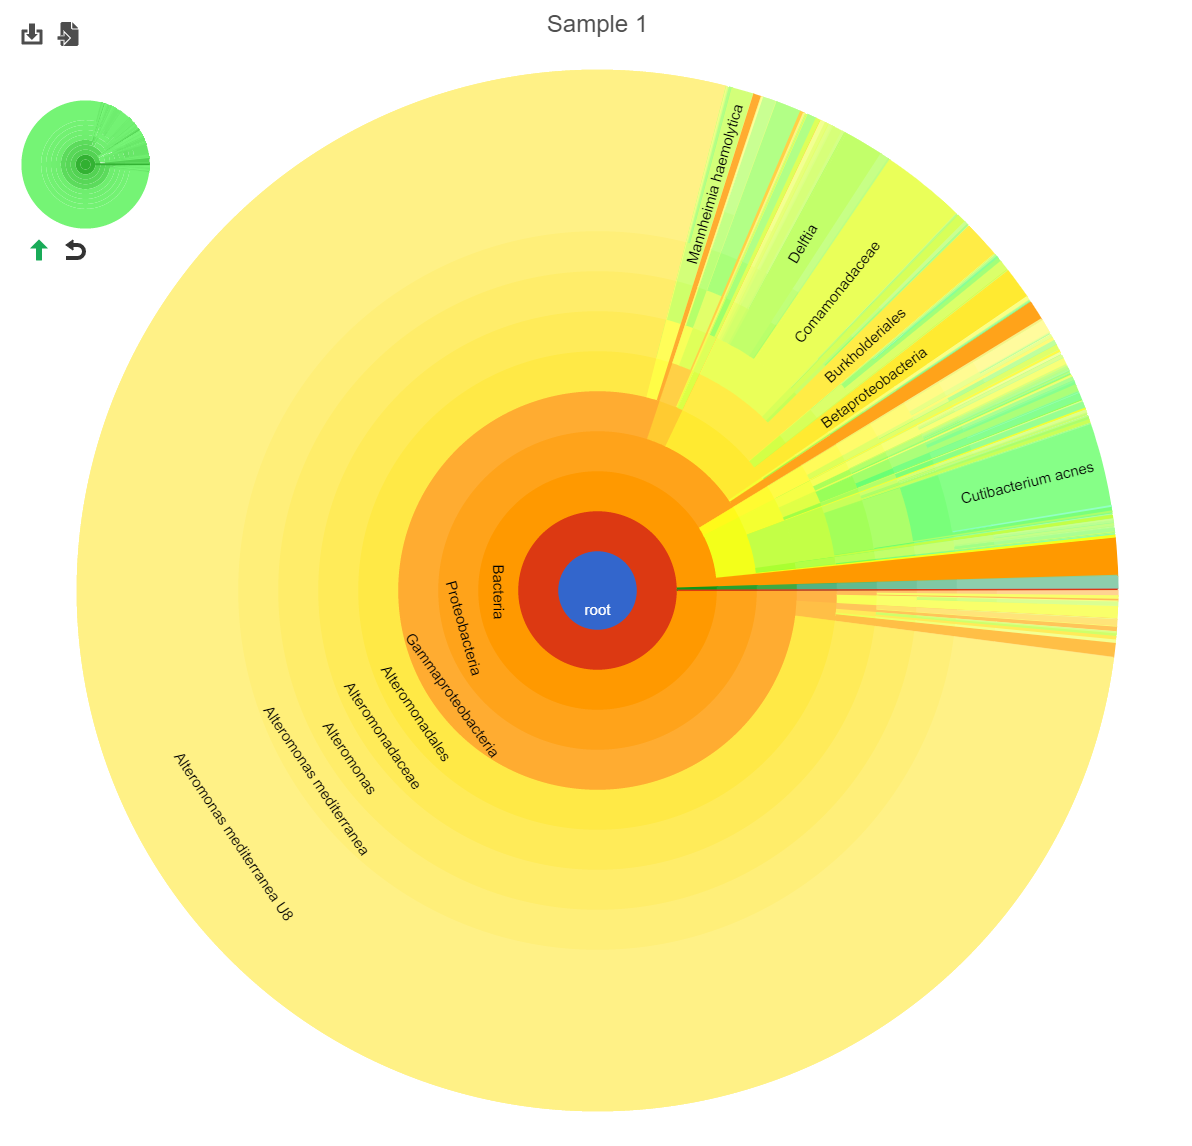 Figure 4. Hierarchical clustering pie chart
Clicking a section of the pie chart zooms in to that section by setting the selected level as the root (Figure 2).
Figure 4. Hierarchical clustering pie chart
Clicking a section of the pie chart zooms in to that section by setting the selected level as the root (Figure 2).
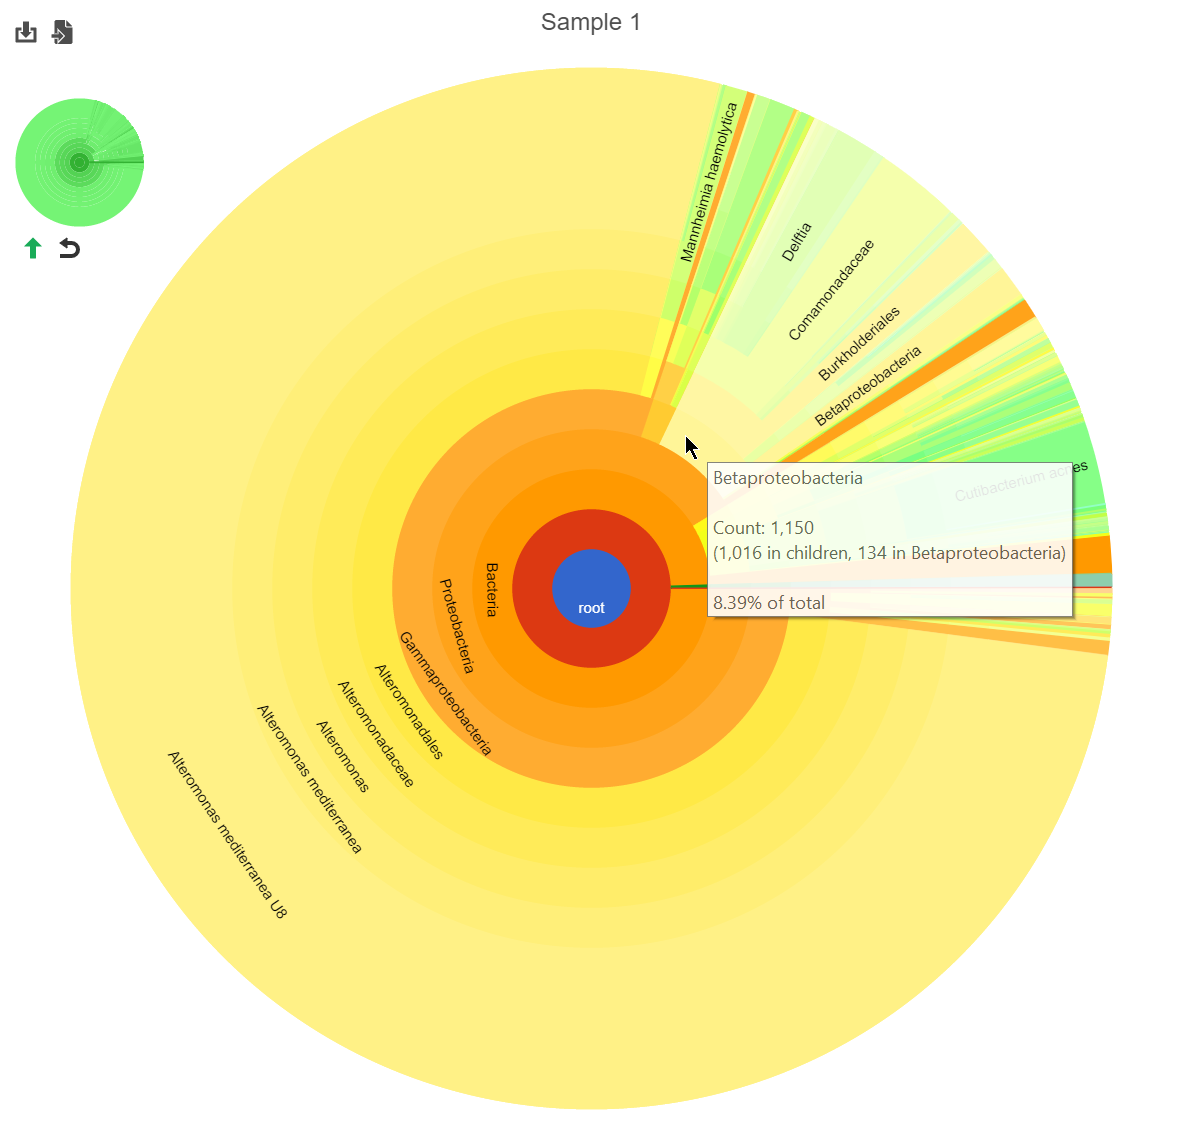
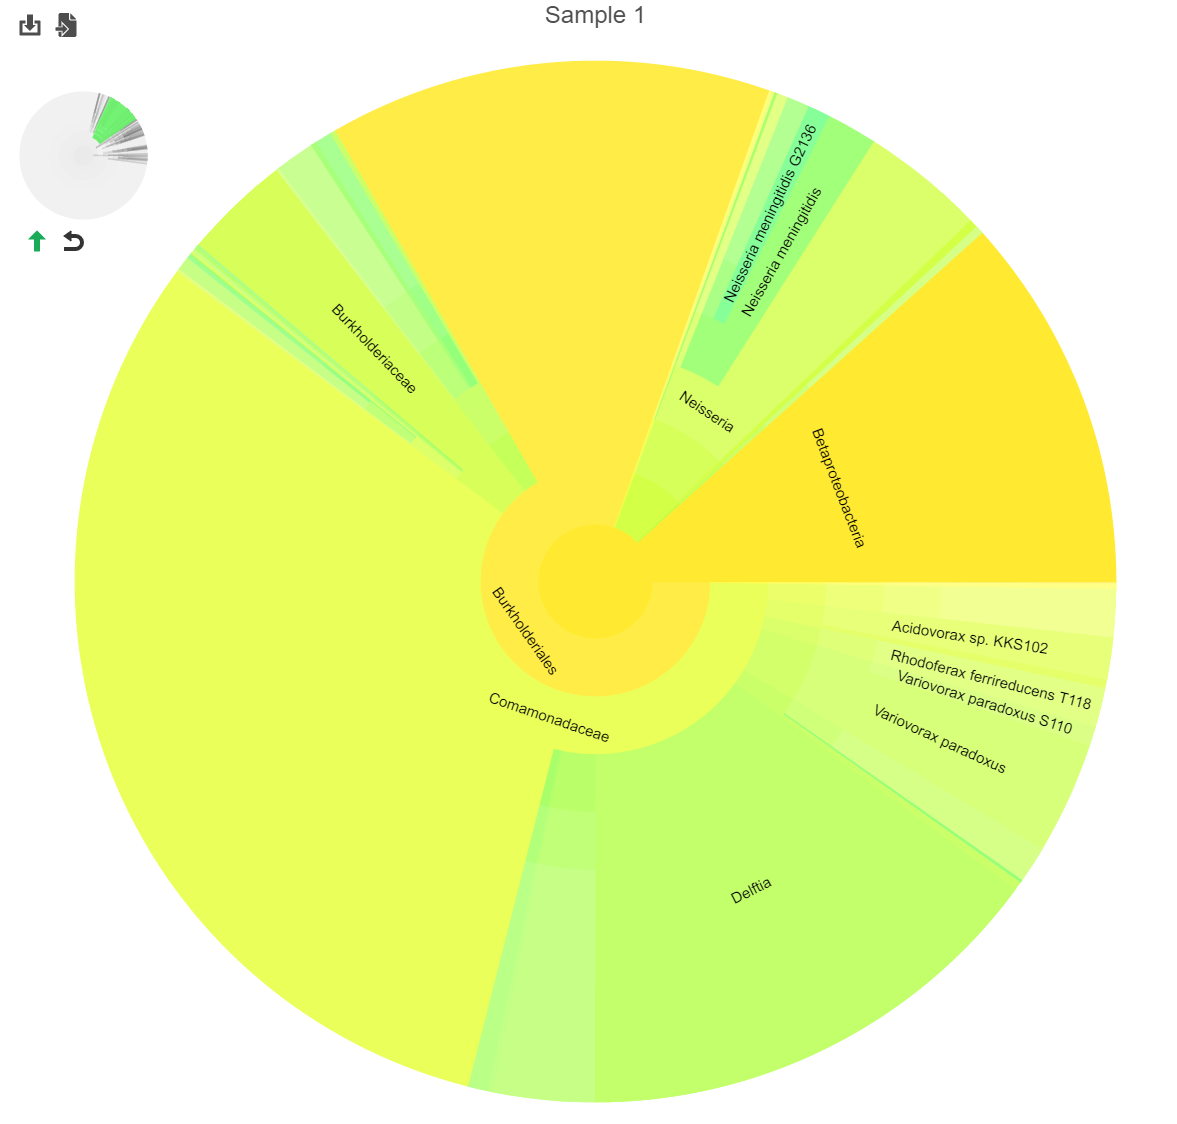 Figure 5. Navigating the pie chart. Original (left); zoomed to a selected section (right).
Click the green arrow
Figure 5. Navigating the pie chart. Original (left); zoomed to a selected section (right).
Click the green arrow![]() to move up one taxanomic level (set the root to one level higher). Click reset
to move up one taxanomic level (set the root to one level higher). Click reset ![]() to show the entire pie chart.
to show the entire pie chart.
The mini-map on the upper left is shaded to indicate which section of the original pie chart is currently shown (Figure 2).
References
[1] Wood DE, Salzberg SL: Kraken: ultrafast metagenomic sequence classification using exact alignments. Genome Biology 2014, 15:R46.
Additional Assistance
If you need additional assistance, please visit our support page to submit a help ticket or find phone numbers for regional support.


| Your Rating: |
|
Results: |

|
0 | rates |
Overview
Content Tools