Page History
| Table of Contents | ||||||
|---|---|---|---|---|---|---|
|
Space Ranger output
The Visium spatial gene expression solution from 10X Genomics allows us to spatially resolve RNA-Seq expression data in individual tissue sections. For the analysis of Visium spatial gene expression data in Partek Flow, you will need the following output files from the Space Ranger outs1 subdirectory:
...
| Numbered figure captions | ||||
|---|---|---|---|---|
| ||||
|
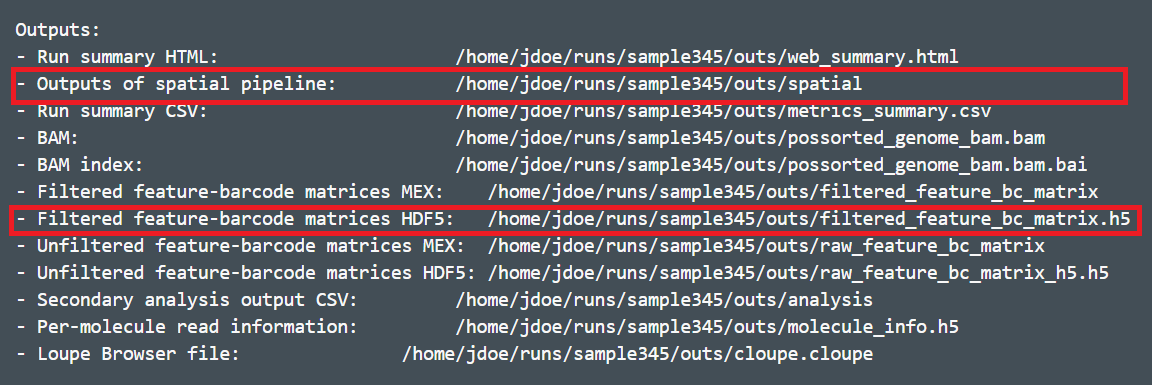
We recommend import count matrix file using .h5 file format, which allow you to import multiple samples at the same time. You need to rename the file names and put all the files in the sample folder to import in one go.
...
The folder should be compressed in one .gz or zip file when you upload to Flow server. You can pick the file for each sample from the Partek Flow server, your local computer, or a URL using the file browser .
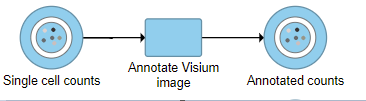
Annotate Visium image
To run Annotate cells:
- Click a Single cell counts data node
- Click the Pre-analysis tools section in the toolbox
- Click Annotate Visium image
...
| Numbered figure captions | ||||
|---|---|---|---|---|
| ||||
|

- Click Finish
A new data node, Annotated counts, will be generated (Figure 3).
| Numbered figure captions | ||||
|---|---|---|---|---|
| ||||
|
When the task report of the annotated counts node is opened (or double click on the Annotated counts node), the images will be displayed in data viewer (Figure 4)
| Numbered figure captions | ||||
|---|---|---|---|---|
| ||||
|
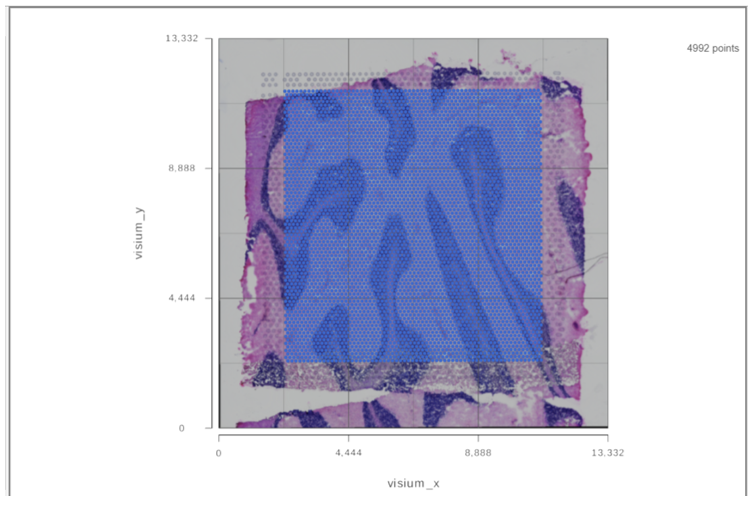
It is a 2D plot and XY axes are the tissue spot coordinates. Tissue spots are on top of the slide image. The opacity of the tissue spots can be changed using the slider to show more of the image under Configure>Style>Color.
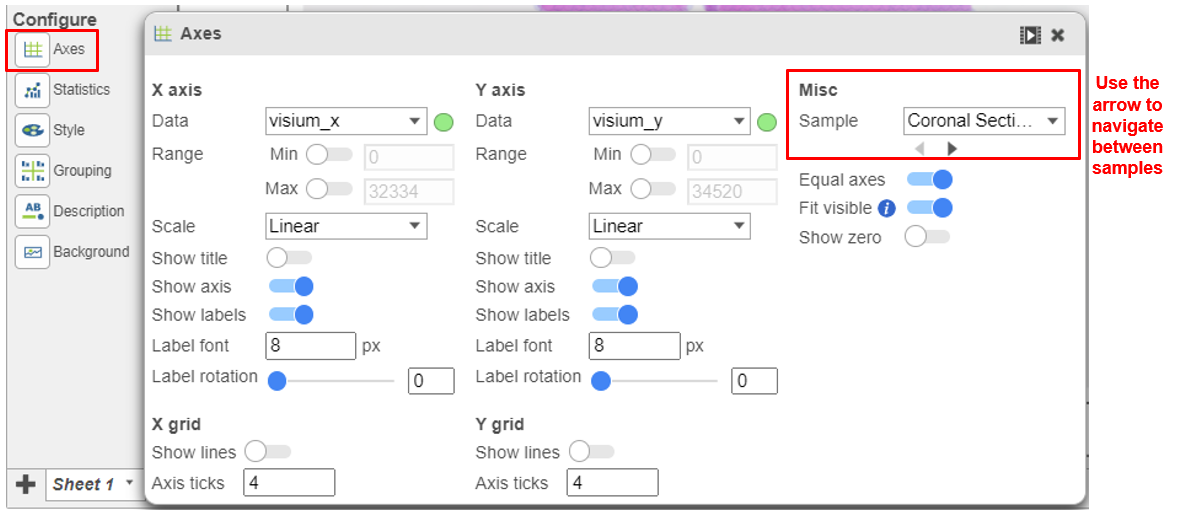
To view different samples, navigate to Axes under Configure Click on the
![]() button under Misc. in the left panel (Figure 5).
button under Misc. in the left panel (Figure 5).
| Numbered figure captions | ||||
|---|---|---|---|---|
| ||||
|
From the Configure>Background>Image drop-down list, different formats of the image can be selected (Figure 6).
| Numbered figure captions | ||||
|---|---|---|---|---|
| ||||
|

Click on ![]() to turn on or off the background image.
to turn on or off the background image.
Note that the "Annotate Visium image" task splits by sample so all of the downstream tasks will also do this (e.g. if the pipeline is built from this node all of the downstream tasks will also be split and viewed per sample). To generate plots with multiple samples on one plot, build the pipeline from the "Single cell counts" node.
References
[1] https://support.10xgenomics.com/spatial-gene-expression/software/pipelines/latest/output/overview
...
Overview
Content Tools