Page History
...
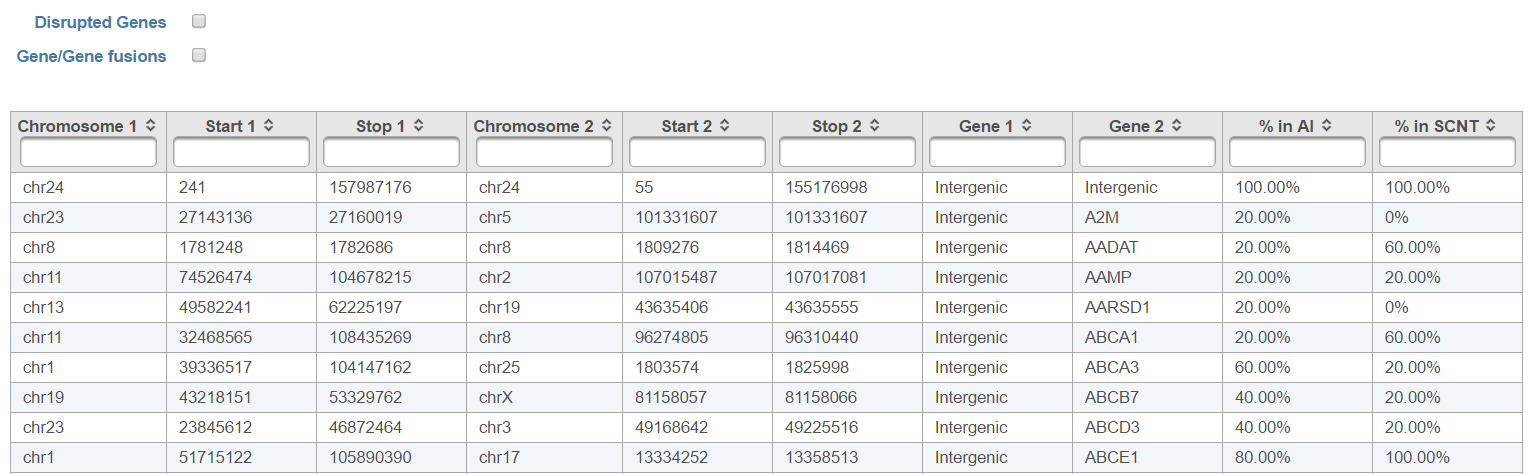
The output, Fusion report table (Figure 1410) resembles the basic TopHat-Fusion output (Figure 117); each row of the table is a single fusion event and three right-most columns are as follows:
...
event while the information on the merged segments is on the columns.
- Chromosome 1: chromosome hosting the first (left) segment of the fusion transcript;
- Start 1: beginning of the first (left) segment of the fusion transcript;
- Stop 1: end of the first (right) segment of the fusion transcript;
- Chromosome 2: chromosome hosting the second (right) segment of the fusion transcript;
- Start 2: beginning of the second (right) segment of the fusion transcript;
- Stop 2: end of the second (left) segment of the fusion transcript;
- Gene1: gene on the left side of the fusion;
- Gene2: gene on the right side of the fusion;
- % in (category name): fraction of samples within the category with the fusion event.
Checkboxes Disrupted Genes and Gene/Gene fusions are filter tools. When selected Disrupted Genes removes all the rows (fusion events) which have no gene assigned to it, i.e. which merge two intergenic regions. However, if there is a fusion between a gene and an intergenic region, it will be kept in the table. Gene/Gene fusions filters in only those fusion events which have an annotated gene on both sided of the breakpoint. In the other words, only gene to gene fusions are kept in the table.
| Numbered figure captions | ||||
|---|---|---|---|---|
| ||||
|
STAR Algorithm
General Overview
...
Overview
Content Tools