Page History
...
| Table of Contents | ||||||
|---|---|---|---|---|---|---|
|
Partek Algorithm
General Overview
The Partek® Flow® fusion detection algorithm uses paired-end information to find pairs of genes that may express as a hybrid. A paired-end read is considered for a fusion event if:
- an alignment from the first-in-pair maps to a different sequence (chromosome) than an alignment from the second-in-pair, or;
- the distance between all alignments from the first-in-pair and the second-in-pair exceed a custom-defined threshold (default: 50 kb).
The algorithm then reports peaks of reads that are potentially involved in a fusion event. Adjacent peaks are merged if their distance is less than 200 bp (default) and the probability that the peak is derived from the null distribution of peaks (determined by permutation) is reported. False positives hits are reduced by ignoring alignments that overlap with regions masked in the .2bit file. Finally, the peaks are annotated with a transcript model and a report is generated for pairs of peaks which map to different transcripts.
Running Partek Fusion Gene Algorithm within Partek Flow
Partek algorithm can be invoked on a data node containing aligned paired-end reads (i.e. Aligned reads node), through the Detect fusion genes link in the Variant detection section of the toolbox (Figure 1).
| Numbered figure captions | ||||
|---|---|---|---|---|
| ||||
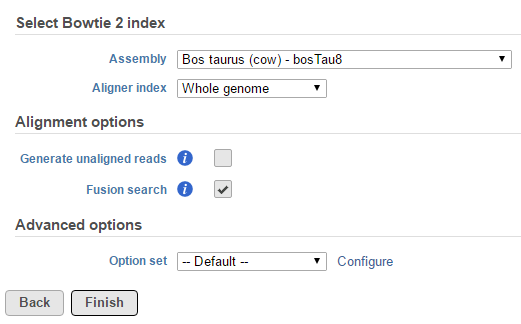
First, the genome build that should be used for fusion gene detection needs to be specified (Figure 2).
| Numbered figure captions | ||||
|---|---|---|---|---|
| ||||
The next dialog (Fusion options; Figure 3) allows for optimization of several parameters. Min distance between ends specifies the minimum distance (bp) between first in pair and second in pair reads to be considered for a fusion event, while Window gap (bp) defines the minimum distance that needs to be detected between two neighboring fusion candidates in order to label them as independent fusion events. The Annotation model is required to annotate the components of the fusion gene in the output table (see below).
| Numbered figure captions | ||||
|---|---|---|---|---|
| ||||
As a result, a new data node (Fusion) will be created (Figure 4). Selecting the Fusion node opens the toolbox and the list of fusion genes can then be reached via the Task report link.
| Numbered figure captions | ||||
|---|---|---|---|---|
| ||||
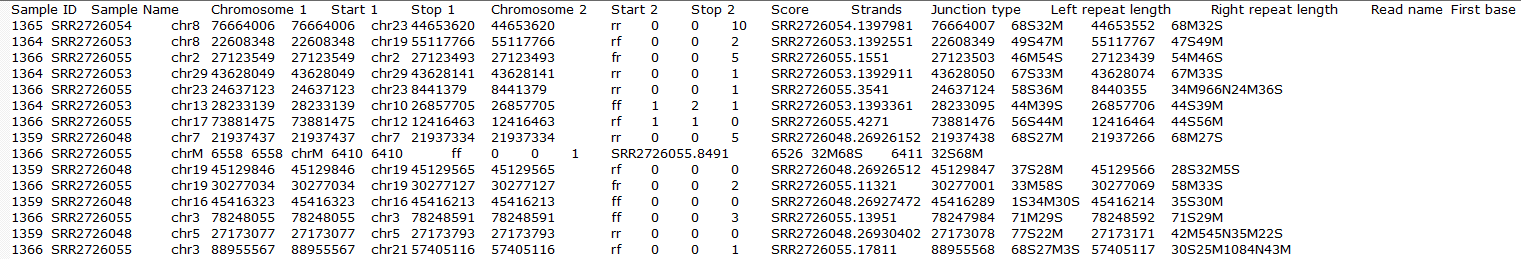
An example of the output, i.e. Fusion report, is shown in Figure 5. Each row of the table is a potential fusion event, with the columns providing the following information.
- Chromosome1: chromosome ID for the gene on the left side of the fusion;
- Start1: start position of the segment on the left;
- Stop1: stop position of the segment of the left;
- Chromosome 2: chromosome ID for the gene on the right side of the fusion;
- Start2: start position of the segment on the right;
- Stop2: stop position of the segment on the left;
- Sample ID: sample in which the fusion event was identified;
- Counts: number of supporting reads;
- p-value: p-value for the chi-squared test comparing the observed number of counts against the expected number (background distribution);
- Gene1: gene on the left side of the fusion;
- Gene2: gene on the right side of the fusion.
All the columns can be sorted by using the arrow buttons () in column headers.
| Numbered figure captions | ||||
|---|---|---|---|---|
| ||||
TopHat-Fusion Algorithm
General Overview
TopHat-Fusion is a version of TopHat (see Chapter 6.1) with the ability to align reads across fusion points and detect fusion genes resulting from breakage and re-joining of two different chromosomes or from rearrangements within a chromosome (3). It is independent of gene annotation and can discover fusion products from known genes, unannotated splice variants of known genes or completely unknown genes.
...
The most up to date TopHat-Fusion version implemented in Partek Flow when the manual was written (2.1.0.8) focuses on fusions due to chromosomal rearrangements, while fusions resulting from read-through transcription or trans-splicing were not supported. TopHat-Fusion can handle both paired- and single-end reads, but the support of color-space reads is still pending. For details as well as discussion of TopHat-Fusion options, see TopHat-Fusion home page (4).
...
TopHat-Fusion is integrated with TopHat 2 and fusion detection is activated by using the Fusion search check box in the TopHat 2 Alignment options dialog (Figure 61).
| Numbered figure captions | ||||
|---|---|---|---|---|
| ||||
|
The output is associated with dumped to the Fusion results data node (Figure 72), which is a part of TopHat 2 results (in addition to Aligned reads node and, optionally, Unaligned reads node).
...
| Numbered figure captions | ||||
|---|---|---|---|---|
| ||||
STAR Algorithm
General Overview
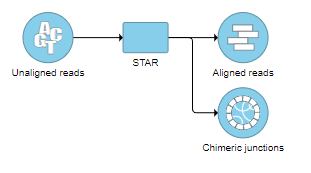
STAR aligner (see Chapter 6.1) also has the ability to detect fusion genes (referred to as “chimeric alignments”) (5). During the first phase of alignment, STAR searches for maximal mappable prefixes (seeds) of sequencing reads. In the second phase, all the seeds that align within user-defined genomic windows are stitched together. If an alignment within one genomic window does not cover the entire read sequence, STAR will try to find two or more windows that cover the entire read. This essentially results in detection of fusion events, with different parts of reads aligning to distal genomic locations, or different chromosomes, or different strands.
The most up to date STAR version implemented in Partek Flow when the manual was written (2.3.0) aligns both paired- and single-end reads. Color-space reads are not supported.
Running STAR Chimeric Alignment within Partek Flow
...
| Numbered figure captions | ||||
|---|---|---|---|---|
| ||||
|
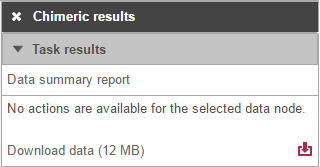
Selecting the Chimeric results node opens the toolbox , with Variant detection options (Figure 17) with twooptions: Data summary report or Download data.
| Numbered figure captions | ||||
|---|---|---|---|---|
| ||||
Fusion report displays an annotated report on detected fusion genes. For that purpose, an annotation file needs to be specified first (Figure 18).
| Numbered figure captions | ||||
|---|---|---|---|---|
| ||||
The result of annotation is the Fusion report task node as seen in Figure 19.
| Numbered figure captions | ||||
|---|---|---|---|---|
| ||||
The list of annotated fusion genes, in a form of Fusion report (Figure 20), can be obtained by first selecting the Fusion report task node and then the Task report link from the toolbox. Each row of the table in Figure 20 is a potential fusion event, with the columns providing the following information.
...
All the columns can be sorted by using the arrow buttons () in column headers.
| Numbered figure captions | ||||
|---|---|---|---|---|
| ||||
...
|
Clicking on the Download data results in download of a .fusion file to the local computer. The file is human readible and can be opened in a text editor (example in Figure 18). For details refer to STAR's documentation.
| Numbered figure captions | |
|---|---|
|
...
|
...
A new data node, Fusion attribute report, is generated in the Analysis tab (Figure 22) and it provides access to the Task report link in the toolbox.
| Numbered figure captions | ||||
|---|---|---|---|---|
| ||||
The output, Fusion report table (Figure 23) resembles the basic TopHat-Fusion output (Figure 11); each row of the table is a single fusion event and three right-most columns are as follows:
- p-value: p-value for the chi-squared test comparing the observed number of counts against across the levels of the attribute specified in the setup;
- % in (attribute level): fraction of reads detected within the samples belonging to the specified level of the attribute (each level is presented as a single column).
| Numbered figure captions | ||||
|---|---|---|---|---|
| ||||
...
|
...
|
References
- Annala MJ, Parker BC, Zhang W, Nykter M. Fusion genes and their discovery using high throughput sequencing. Cancer Lett. 2013;340:192-200.
- Costa V, Aprile M, Esposito R, Ciccodicola A. RNA-Seq and human complex diseases: recent accomplishments and future perspectives. Eur J Hum Genet. 2013;21:134-142.
- Kim D, Salzberg SL. TopHat-Fusion: an algorithm for discovery of novel fusion transcripts. Genome Biology. 2011;12:R72
- TopHat-Fusion. An algorithm for discovery of novel fusion transcripts. http:// http://tophat.cbcb.umd.edu/fusion_index.html Accessed on April 25, 2014
- Dobin A, Davies CA, Schlesinger F et al. STAR: ultrafast universal RNA-seq aligner. Bioinformatics. 2013;29:15-21.
| Additional assistance |
|---|
|
| Rate Macro | ||
|---|---|---|
|
Overview
Content Tools