Page History
...
Alternatively, if you have a matrix of data, such as raw read count data in text format, select Import count matrix. This will bring up the Input options page (Figure 8).A box showing a text preview of the first 15 rows The requirements of this text file are listed below:
- The file contains numeric values in a table format, samples can be on rows (features are on columns) or columns (features are on rows)
- The file contains unique sample ID and feature ID
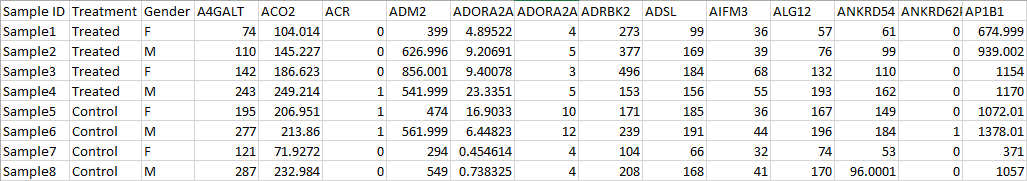
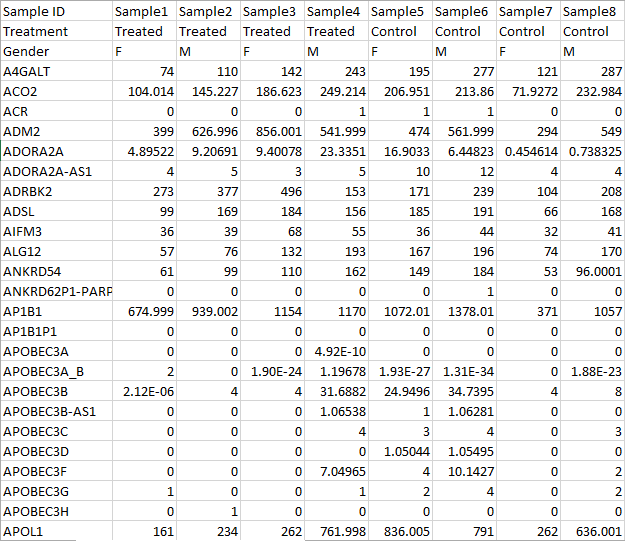
- If there are sample attribute information, all the information have to be at the beginning of the table, the left most columns when samples are on rows (Figure 8) or the top rows when samples are on columns (Figure 9 ).
| Numbered figure captions | ||||
|---|---|---|---|---|
| ||||
 |
| Numbered figure captions | ||||
|---|---|---|---|---|
| ||||
 |
The preview of the first few rows and columns of the text file should help you determine on which row/column the relevant counts are located (the preview will show up to 100 rows and 100 columns). Inspect the text preview and indicate which row the data header begins.
...
| Numbered figure captions | ||||
|---|---|---|---|---|
| ||||
|
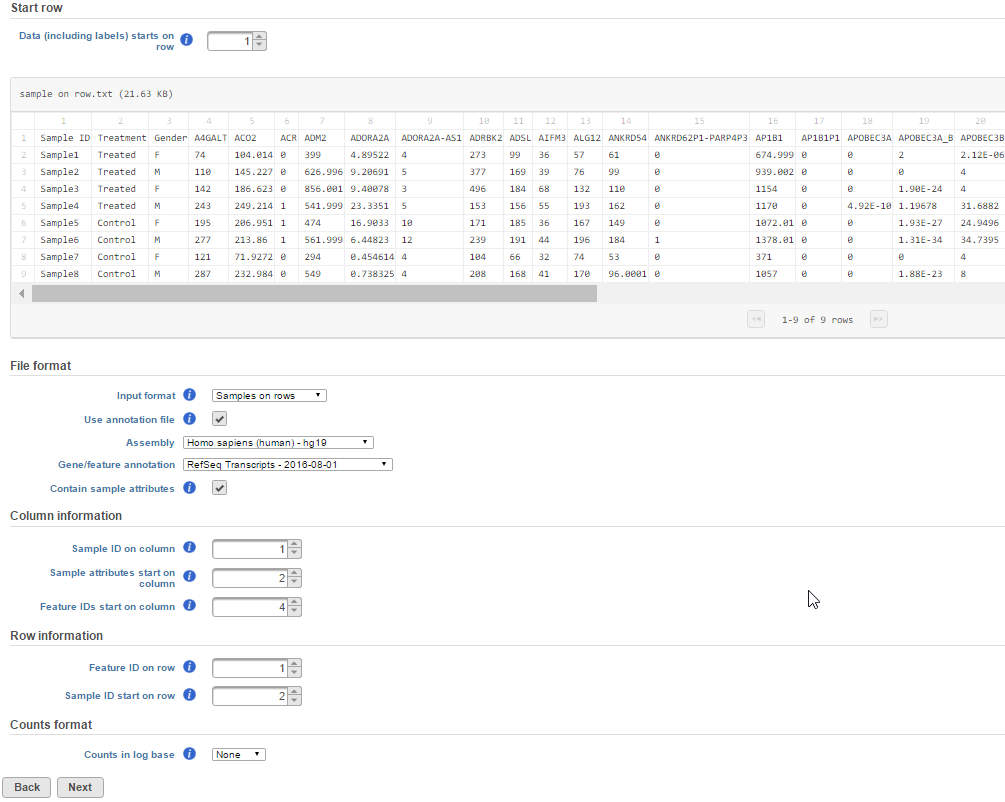
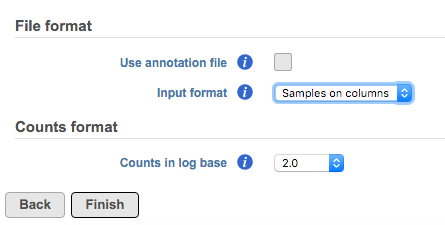
Otherwise, manually specify the orientation of the data matrix by changing the Input format drop-down menu (Figure 9). Figure 9 is showing an example text file contains samples on rows, the first column is sample ID, sample attributes are in column 2 and column 3. Gene count starts from column 4 with gene ID in row one. The gene ID is compatible with hg19 RefSeq transcript 2016-08-01 annotation model.
If the data has been log transformed, specify the base under Counts format.
| Numbered figure captions | ||||
|---|---|---|---|---|
| ||||
|
Project output directory
The project output directory is the folder within the Partek Flow server where all output files produced during analysis will be stored.
...
Overview
Content Tools