Page History
...
| Numbered figure captions | ||||
|---|---|---|---|---|
| ||||
|
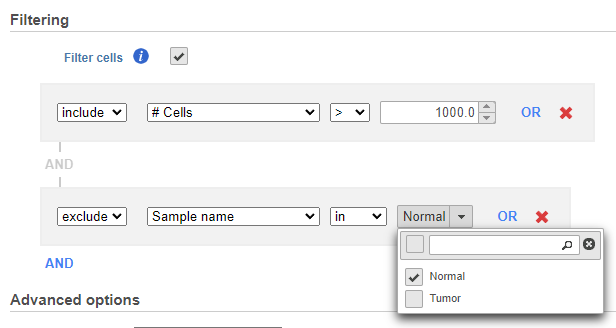
If you do not want to cluster all the samples, but select a subset based on a specific sample or cell attribute (i.e. group membership), check Filter cells under Filtering and set a filtering rule using the drop down lists (Figure 3). Notice the drop-down lists allow more than one factor (when available) to be selected at a time. When configuring the filtering rule, use AND to ensure all conditions pass for inclusion and use OR for any conditions to pass.
| Numbered figure captions | ||||
|---|---|---|---|---|
| ||||
|
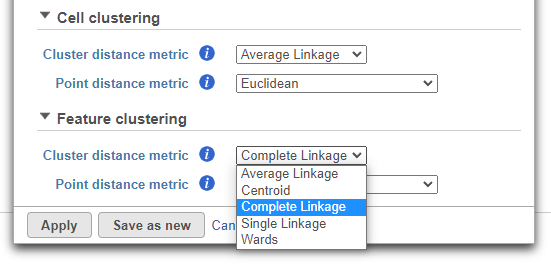
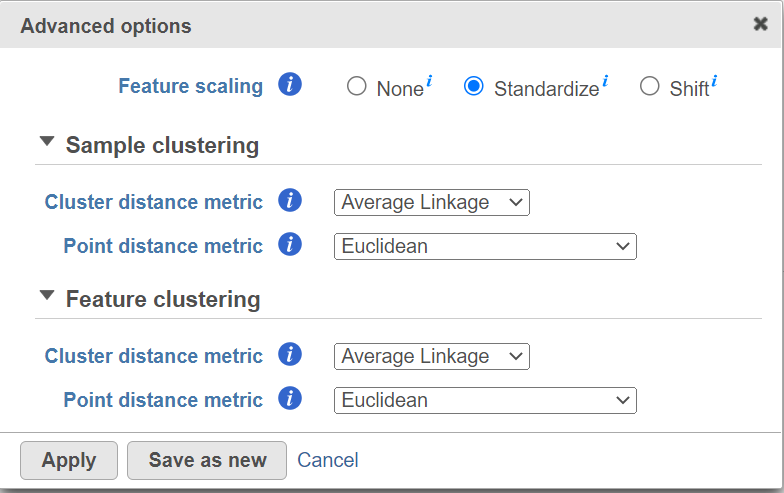
Hierarchical clustering uses distance metrics to sort based on similarity and is set to Average Linkage by default. This can be adjusted by clicking Configure under Advanced options (Figure 4).
Cluster distance metric for cells/samples and features is used to determine how the distance between two clusters will be calculated:
- Single Linkage: the distance between two clusters is determined by the distance of the closest objects in the two clusters
- Complete Linkage: the distance between two clusters is equal to the distance between the two furthest members of those clusters
- Average Linkage: the average distance between all the pairs of objects in the two different clusters is used as the measure of distance between the two clusters
- Centroid method: the distance between two clusters is equal to the distance between the centroids of those clusters
- Ward's method: the distance between two clusters is designed to minimize the size of an error measure based on the sum of squares
Point distance metric is used to determine the distance between two rows or columns. For more detailed information about the equations, we refer you to the distance metrics chapter.
| Numbered figure captions | ||||
|---|---|---|---|---|
| ||||
|
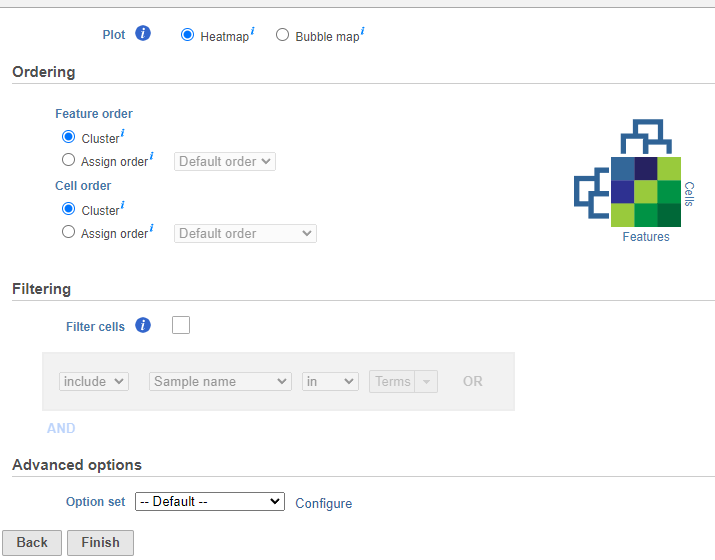
If the Cluster option is unchecked for Cells/Sample/Group order or Feature order, the Ordering option will be Assign order (Figure 5).
The When choose Assign order, the Default order of cells/samples/groups (rows) is based upon the labels as displayed in the Data tab and features (columns) are dependent on the input data of the data node.
...
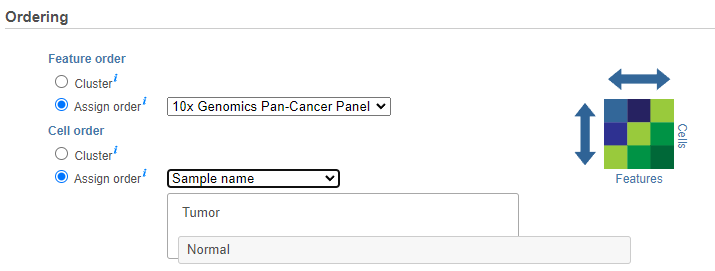
Cell/Sample/Group order can also be assigned by choosing an attribute from the drop down list. Click and drag to rearrange categorical attributes; numeric attributes can be sorted in ascending or descending order (note the arrows in the image which are different from the dendrogram for Cluster) (Figure 3).
| Numbered figure captions | ||||
|---|---|---|---|---|
| ||||
|
Another way to invoke a heatmap without performing clustering is via the data viewer. When you select the Heatmap ![]() icon in the available plots list, data nodes that contain two-dimensional matrices can be used to draw this type of plot. A bubble map can also be similarly plotted (use the arrow from the heatmap icon to select a Bubble map
icon in the available plots list, data nodes that contain two-dimensional matrices can be used to draw this type of plot. A bubble map can also be similarly plotted (use the arrow from the heatmap icon to select a Bubble map ![]() for descriptive statistics that have been generated in the data analysis pipeline.
for descriptive statistics that have been generated in the data analysis pipeline.
If you do not want to cluster all the samples, but select a subset based on a specific sample or cell attribute (i.e. group membership), check Filter cells under Filtering and set a filtering rule using the drop down lists (Figure 3). Notice the drop-down lists allow more than one factor (when available) to be selected at a time. When configuring the filtering rule, use AND to ensure all conditions pass for inclusion and use OR for any conditions to pass.
| Numbered figure captions | ||||
|---|---|---|---|---|
| ||||
|
Hierarchical clustering uses distance metrics to sort based on similarity and is set to Average Linkage by default. This can be adjusted by clicking Configure under Advanced options (Figure 5). You can choose how the data is scaled (sometimes referred to as normalized). Navigate to Advanced options → Configure → There are three Feature scaling options, Standardize (default for a heatmap) will make each column mean as zero and standard deviation as 1 in all features. This is the default scaling for a heatmap and it makes all of the features (e.g., genes or proteins) have equal weight; standardized values are also known as Z-scores. The scaling mode Shift will make each column mean as zero. Choose None to not scale and perform clustering on the values in the quantified input data node (this is the default for a bubble map). If a bubble map is scaled, scaling will be performed on the group summary method (color).
Another way to invoke a heatmap without performing clustering is via the data viewer. When you select the Heatmap ![]() icon in the available plots list, data nodes that contain two-dimensional matrices can be used to draw this type of plot. A bubble map can also be similarly plotted (use the arrow from the heatmap icon to select a Bubble map
icon in the available plots list, data nodes that contain two-dimensional matrices can be used to draw this type of plot. A bubble map can also be similarly plotted (use the arrow from the heatmap icon to select a Bubble map ![]() for descriptive statistics that have been generated in the data analysis pipeline.
for descriptive statistics that have been generated in the data analysis pipeline.
Cluster distance metric for cells/samples and features is used to determine how the distance between two clusters will be calculated:
- Single Linkage: the distance between two clusters is determined by the distance of the closest objects in the two clusters
- Complete Linkage: the distance between two clusters is equal to the distance between the two furthest members of those clusters
- Average Linkage: the average distance between all the pairs of objects in the two different clusters is used as the measure of distance between the two clusters
- Centroid method: the distance between two clusters is equal to the distance between the centroids of those clusters
- Ward's method: the distance between two clusters is designed to minimize the size of an error measure based on the sum of squares
Point distance metric is used to determine the distance between two rows or columns. For more detailed information about the equations, we refer you to the distance metrics chapter.
| Numbered figure captions | ||||
|---|---|---|---|---|
| ||||
|
Heatmap
The output of a Hierarchical clustering task can be a heatmap (Figure 6) or a bubble map with or without dendrograms depending on whether you performed clustering on cells/samples/groups or features. By default, samples are on rows (sample labels are displayed as seen in the Data tab) and features (depending on the input data) are on columns. Colors are based on standardized expression values (default selection; performed on the fly). Dendrograms show clustering of rows (samples) and columns (variables).
...
Overview
Content Tools